Free Access
Fig. 7.
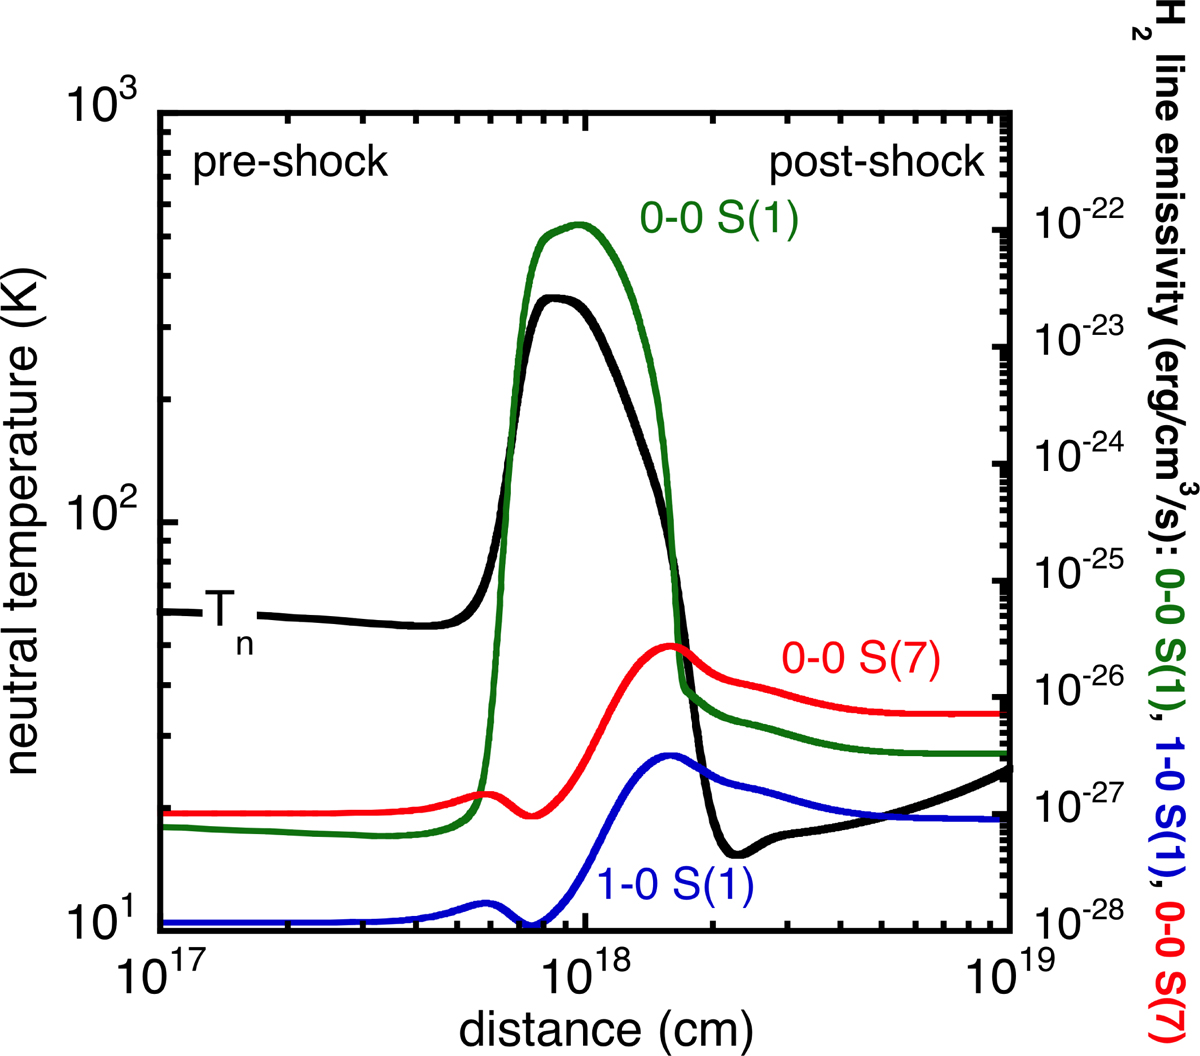
Structure of the shock layer for the best-fit model with nH = 100 cm−3, vs = 10 km s−1, and G0 = 0. The black line represents the neutral temperature profile. We also show predictions of the local emissivity for three H2 lines (colour lines).
Current usage metrics show cumulative count of Article Views (full-text article views including HTML views, PDF and ePub downloads, according to the available data) and Abstracts Views on Vision4Press platform.
Data correspond to usage on the plateform after 2015. The current usage metrics is available 48-96 hours after online publication and is updated daily on week days.
Initial download of the metrics may take a while.