Fig. 6.
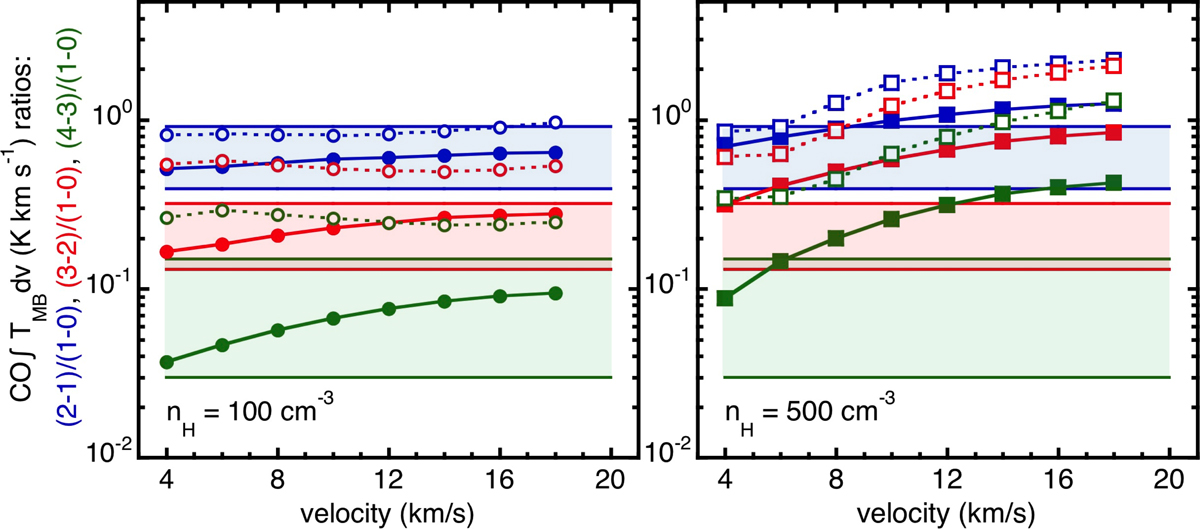
Results obtained with the Paris-Durham shock model. Each panel corresponds to a different pre-shock density: nH = 100 (left) and 500 cm−3 (right). The three coloured rectangles (blue, red, and green) show the observational results: the (2-1)/(1-0), (3-2)/(1-0), and (4-3)/(1-0) ratios, respectively (from Table 2). Each point corresponds to a set of {nH, G0, and vs} values; vs values are indicated in the X-axis. The model results are shown with symbols: filled or empty for G0 = 0 or 1, respectively.
Current usage metrics show cumulative count of Article Views (full-text article views including HTML views, PDF and ePub downloads, according to the available data) and Abstracts Views on Vision4Press platform.
Data correspond to usage on the plateform after 2015. The current usage metrics is available 48-96 hours after online publication and is updated daily on week days.
Initial download of the metrics may take a while.