Fig. 4.
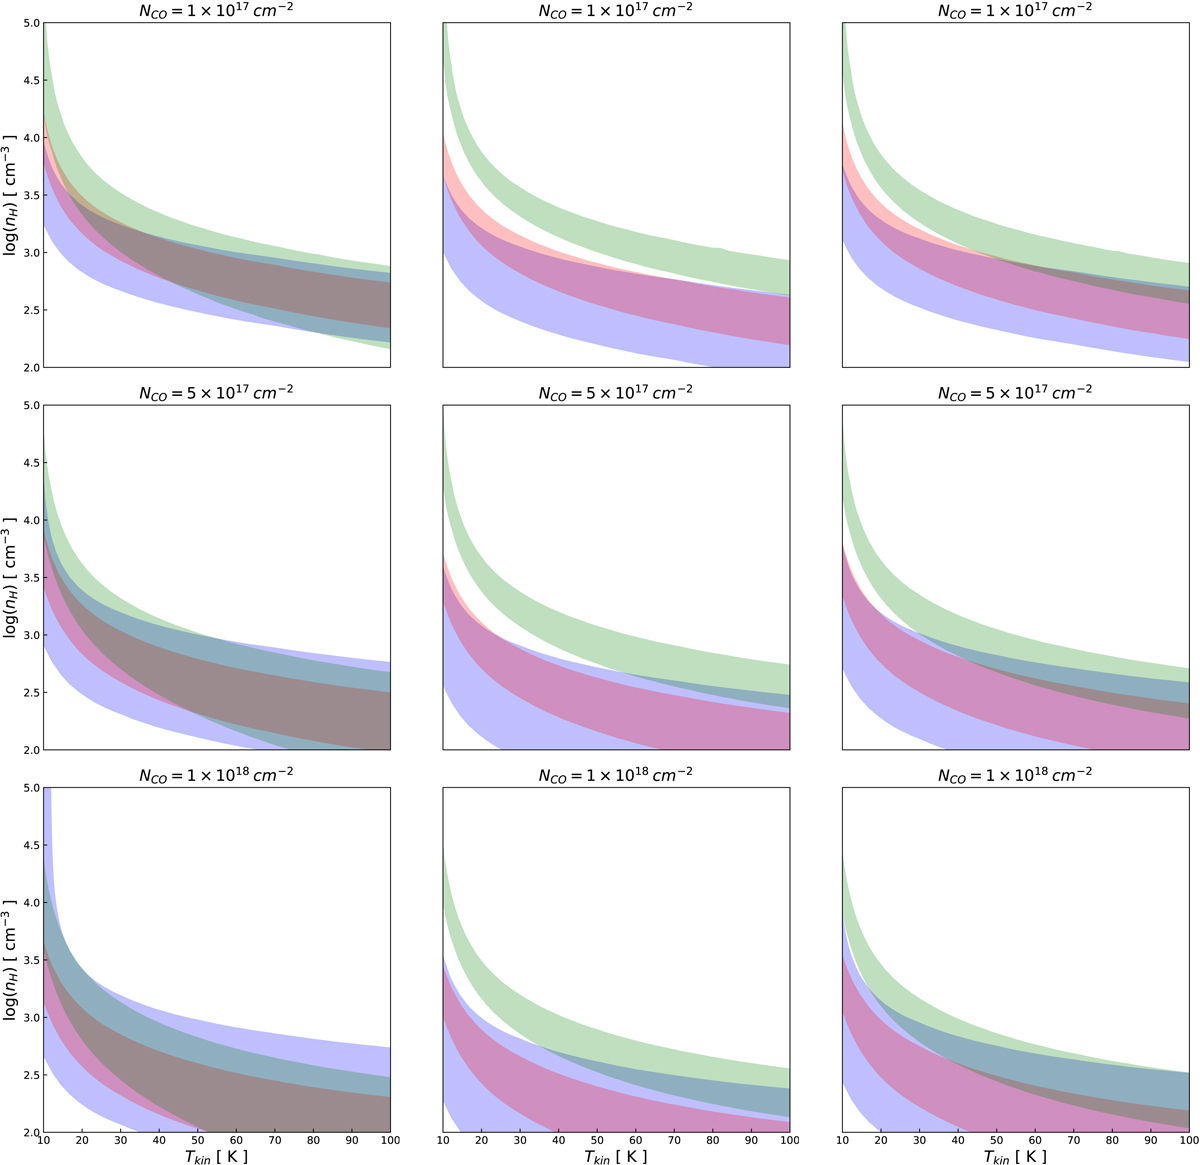
Radiative transfer predictions of the CO intensity line ratios as a function of the temperature and density. The blue, red, and green areas show the observed CO(2-1)/CO(1-0), CO(3-2)/CO(1-0), and CO(4-3)/CO(1-0) ratio. The darkest area corresponds to the models which fit the observations. From left to right, the columns correspond to the blueshifted velocity component, the redshifted velocity component and all the emission, respectively.
Current usage metrics show cumulative count of Article Views (full-text article views including HTML views, PDF and ePub downloads, according to the available data) and Abstracts Views on Vision4Press platform.
Data correspond to usage on the plateform after 2015. The current usage metrics is available 48-96 hours after online publication and is updated daily on week days.
Initial download of the metrics may take a while.