Fig. 3.
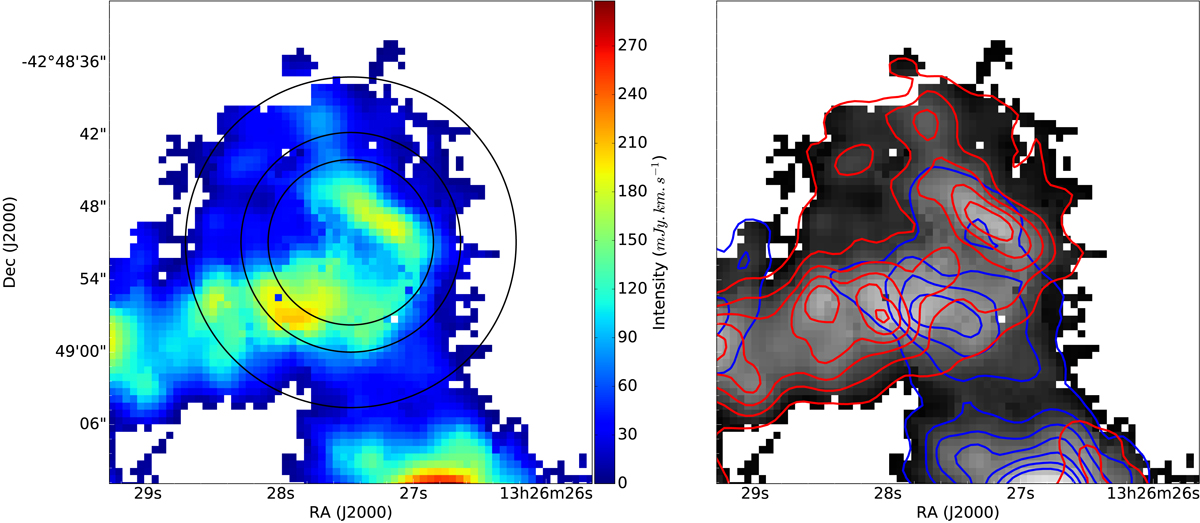
Left: intensity map of the 12CO(1-0) emission as seen by ALMA+ACA in the region observed with APEX. From outer to inner, the circles correspond to the beam of APEX for the 12CO(2-1), (3-2) and (4-3). Right: distribution of the two ALMA velocity components. Contours of each component intensity are overlaid on the total intensity map (grey colour).
Current usage metrics show cumulative count of Article Views (full-text article views including HTML views, PDF and ePub downloads, according to the available data) and Abstracts Views on Vision4Press platform.
Data correspond to usage on the plateform after 2015. The current usage metrics is available 48-96 hours after online publication and is updated daily on week days.
Initial download of the metrics may take a while.