Fig. 1.
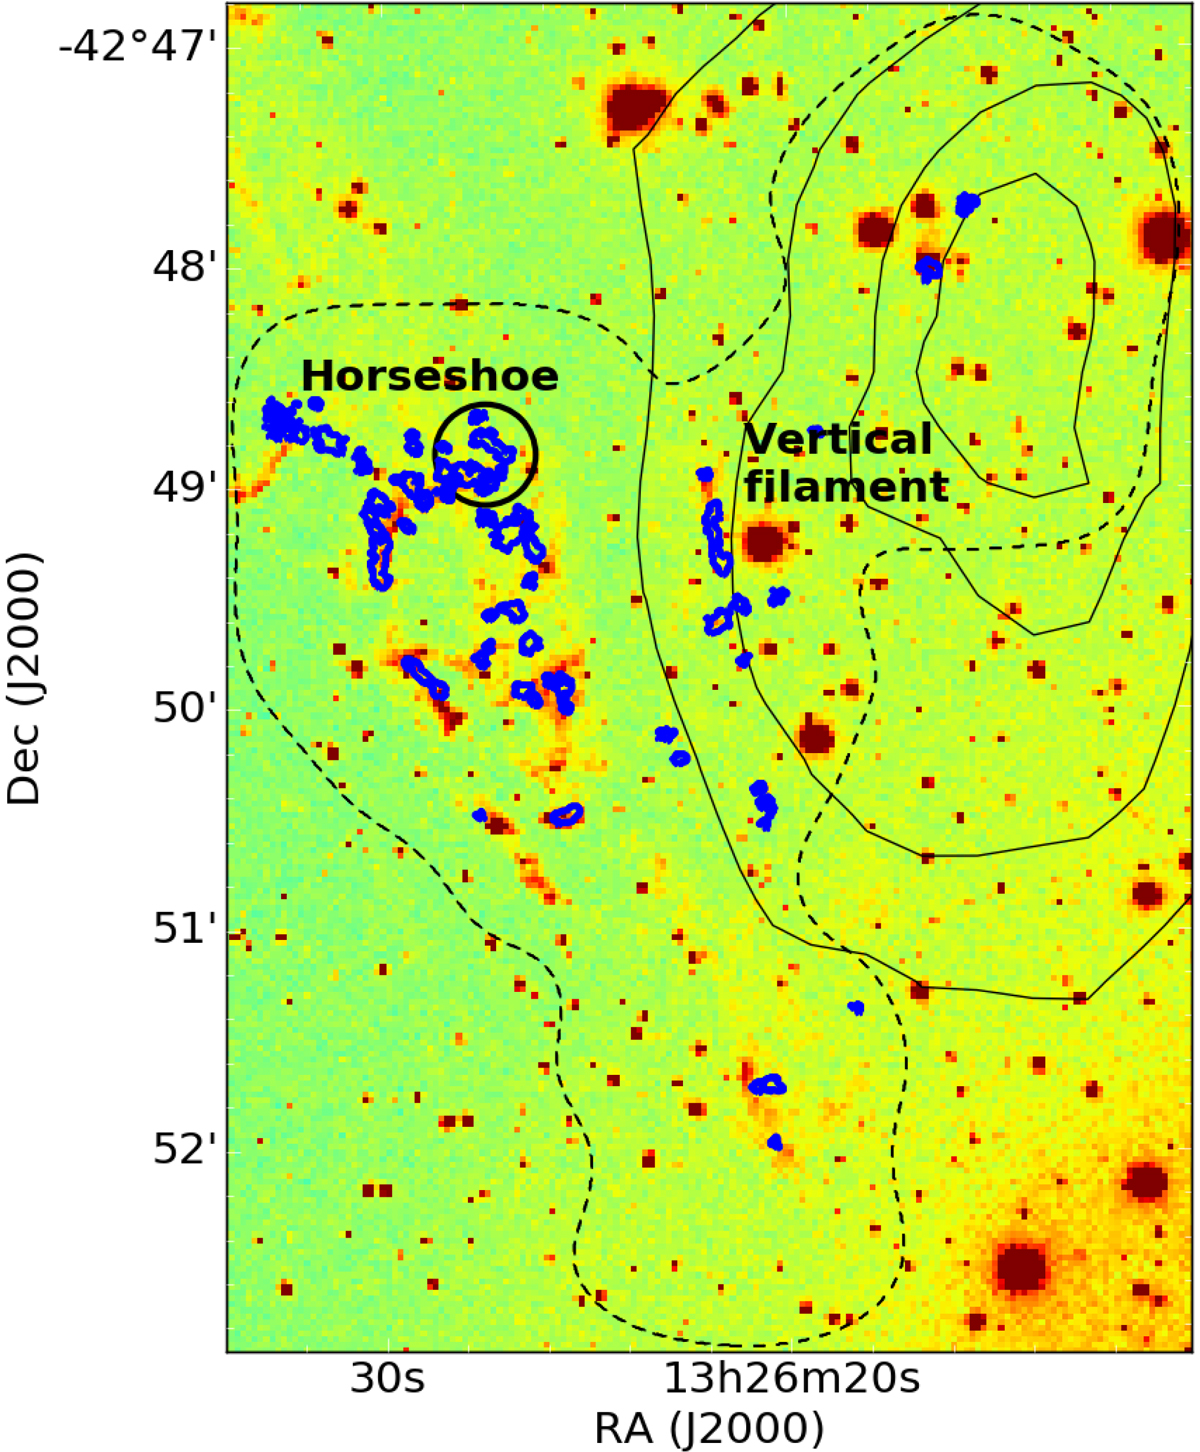
Distribution of the ALMA 12CO(1-0) emission without short-spacings (blue contours) in relation with the Hα emission seen with the Cerro Tololo Inter-American Observatory (CTIO). The black contours represent the H I emission and the black dashed line corresponds to the area observed with ALMA. The black circle indicates the position and size of the 27.4″ beam of APEX for the 12CO(2-1) line, centred on the observed position.
Current usage metrics show cumulative count of Article Views (full-text article views including HTML views, PDF and ePub downloads, according to the available data) and Abstracts Views on Vision4Press platform.
Data correspond to usage on the plateform after 2015. The current usage metrics is available 48-96 hours after online publication and is updated daily on week days.
Initial download of the metrics may take a while.