Fig. C.1
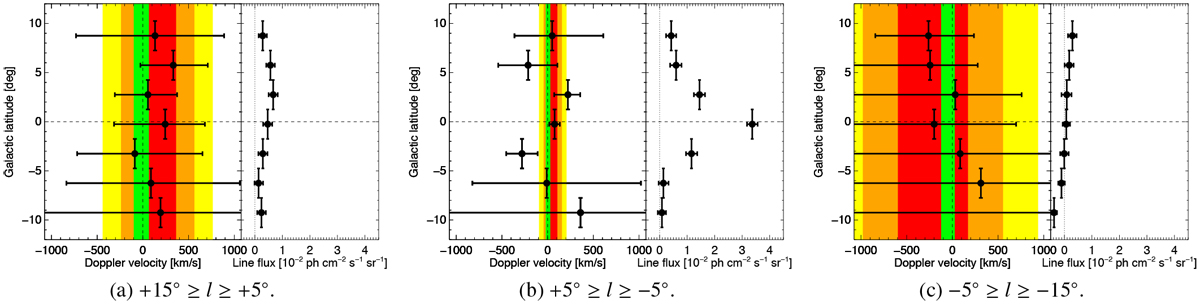
Systematic variations in velocity and flux along galactic latitudes and longitudes from the sliding window method. The data points shown are not independent and have partial overlaps in the SPI data space. The left panel of each plot shows the estimated Doppler-velocity as a function of latitude (black data points), together the weighted mean and its 1, 2, and 3σ uncertaintyband in red, orange, and yellow, respectively. The value from the high signal-to-noise spectra, Fig. 3, are marked by a green band. The right panels show the derived flux of the 511 keV line in each spectrum. See text for more detail.
Current usage metrics show cumulative count of Article Views (full-text article views including HTML views, PDF and ePub downloads, according to the available data) and Abstracts Views on Vision4Press platform.
Data correspond to usage on the plateform after 2015. The current usage metrics is available 48-96 hours after online publication and is updated daily on week days.
Initial download of the metrics may take a while.