Fig. B.1
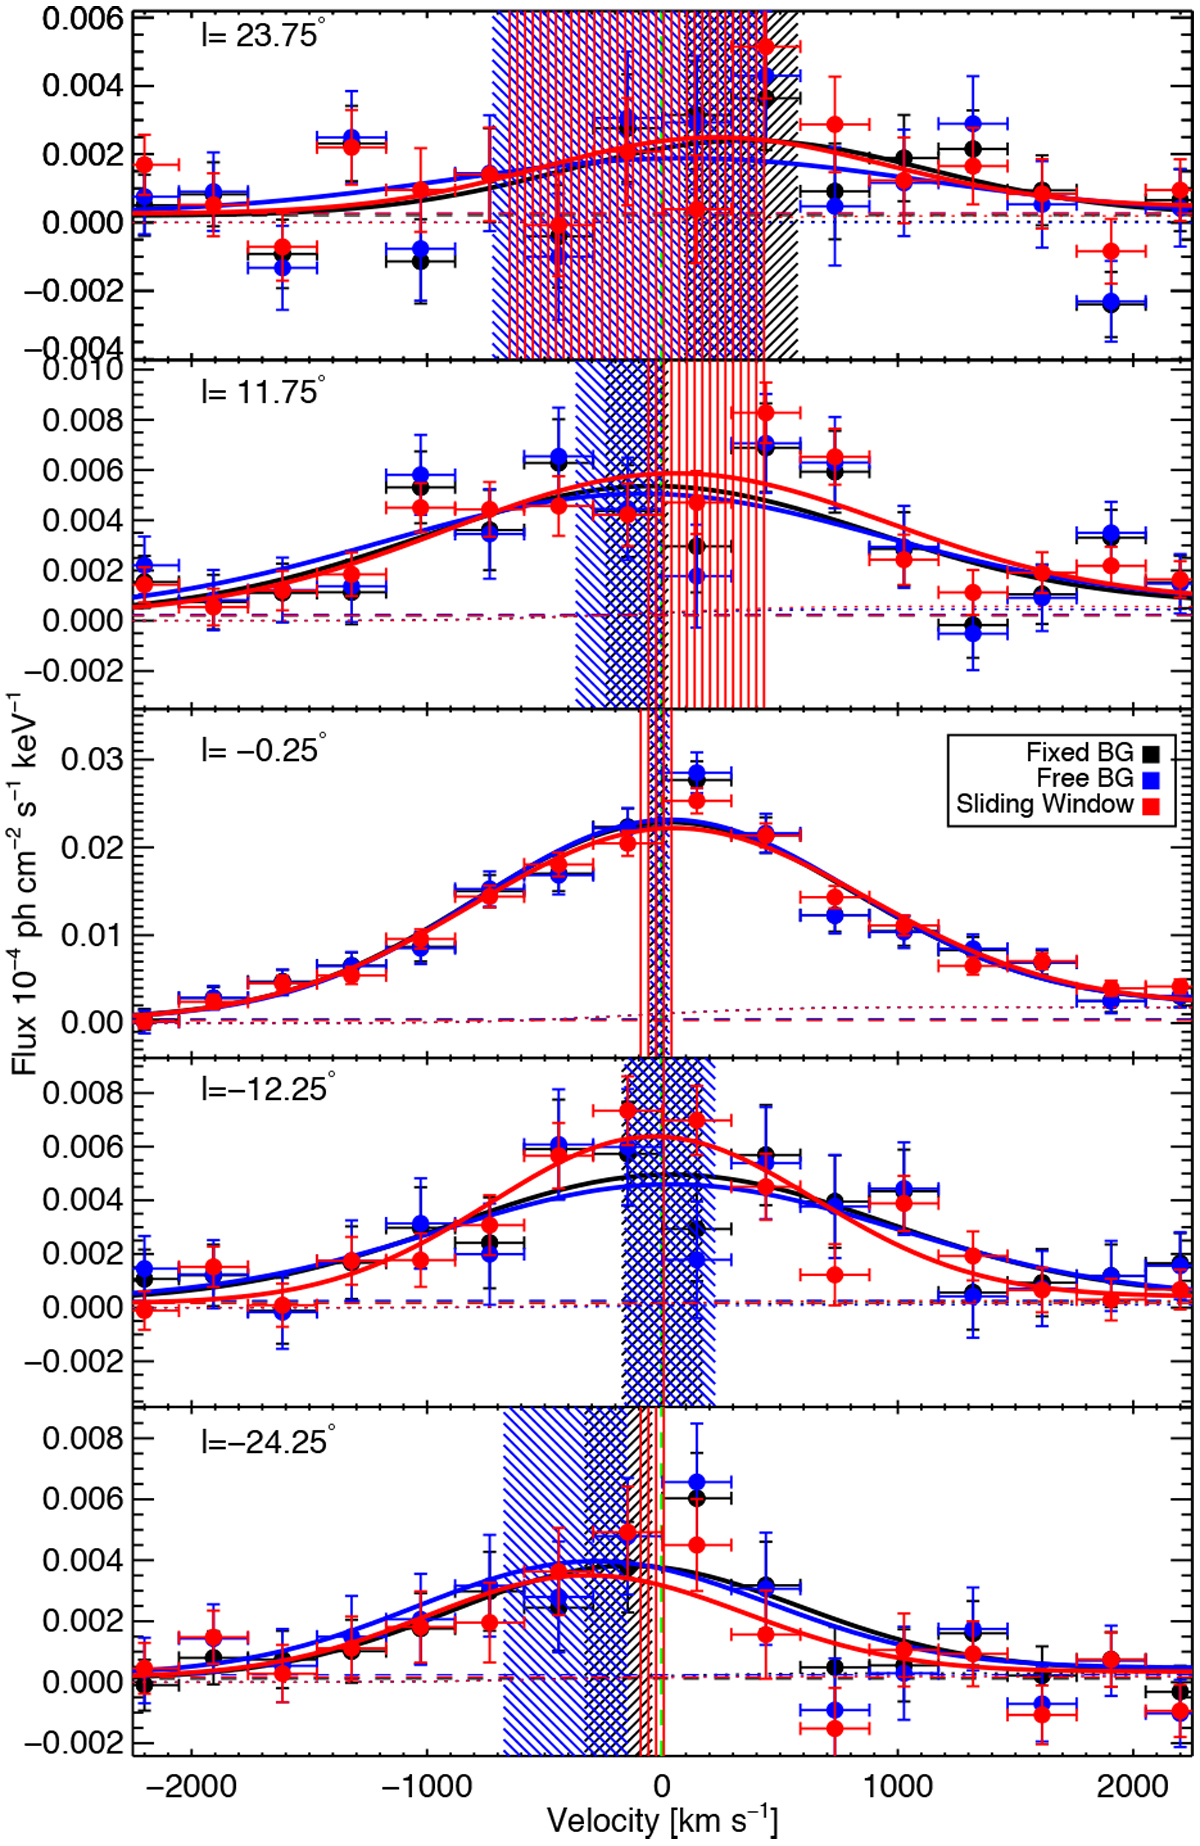
Extracted ROI spectra (1σ errors bars)in velocity space for three analysis methods. Each spectrum has been fitted with the spectral model of Eq. (5, thick solid lines), similar to Fig. 3. The fitted Doppler-shifts and their uncertainties are marked by the hatched areas in the respective colours. The spectra are consistent with each other, and their fitted Doppler-shifts coincide.
Current usage metrics show cumulative count of Article Views (full-text article views including HTML views, PDF and ePub downloads, according to the available data) and Abstracts Views on Vision4Press platform.
Data correspond to usage on the plateform after 2015. The current usage metrics is available 48-96 hours after online publication and is updated daily on week days.
Initial download of the metrics may take a while.