Fig. 3
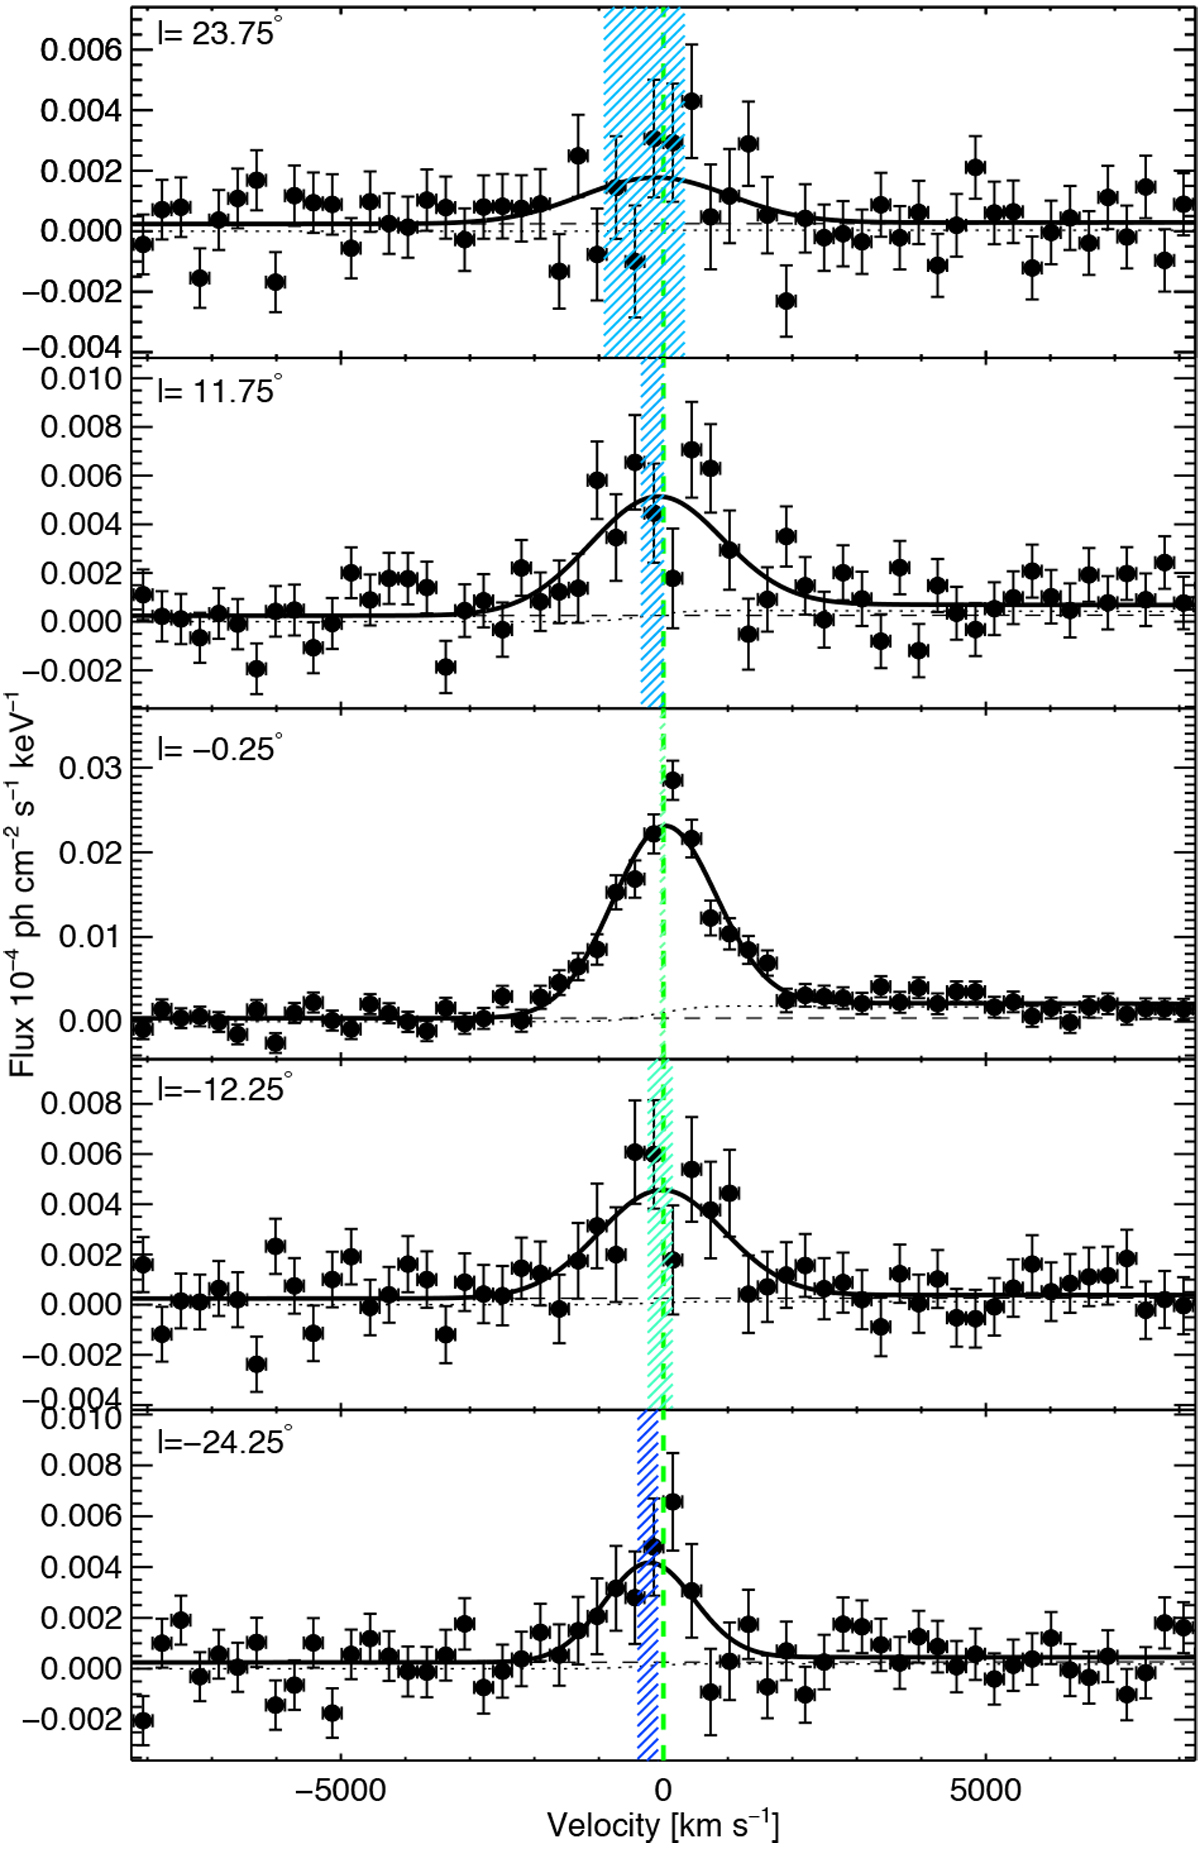
Compilation of extracted ROI spectra (black data points, 1σ errors bars)in velocity space for different longitude regions (annotation in the upper left). Each spectrum has been fitted with the spectral model of Eq. (5, thick solid line). Different spectral components are the diffuse continuum (dashed line), and the ortho-positronium continuum (dotted line), and the degraded Gaussian line with the fitted Doppler-shifts and their uncertainties marked by the hatched areas. These indicate either blue-shift, red-shift, or no shift. A trend from positive to negative longitudes, as could be expected from galactic rotation, is absent. The y-axis scale varies between panels.
Current usage metrics show cumulative count of Article Views (full-text article views including HTML views, PDF and ePub downloads, according to the available data) and Abstracts Views on Vision4Press platform.
Data correspond to usage on the plateform after 2015. The current usage metrics is available 48-96 hours after online publication and is updated daily on week days.
Initial download of the metrics may take a while.