Fig. 2
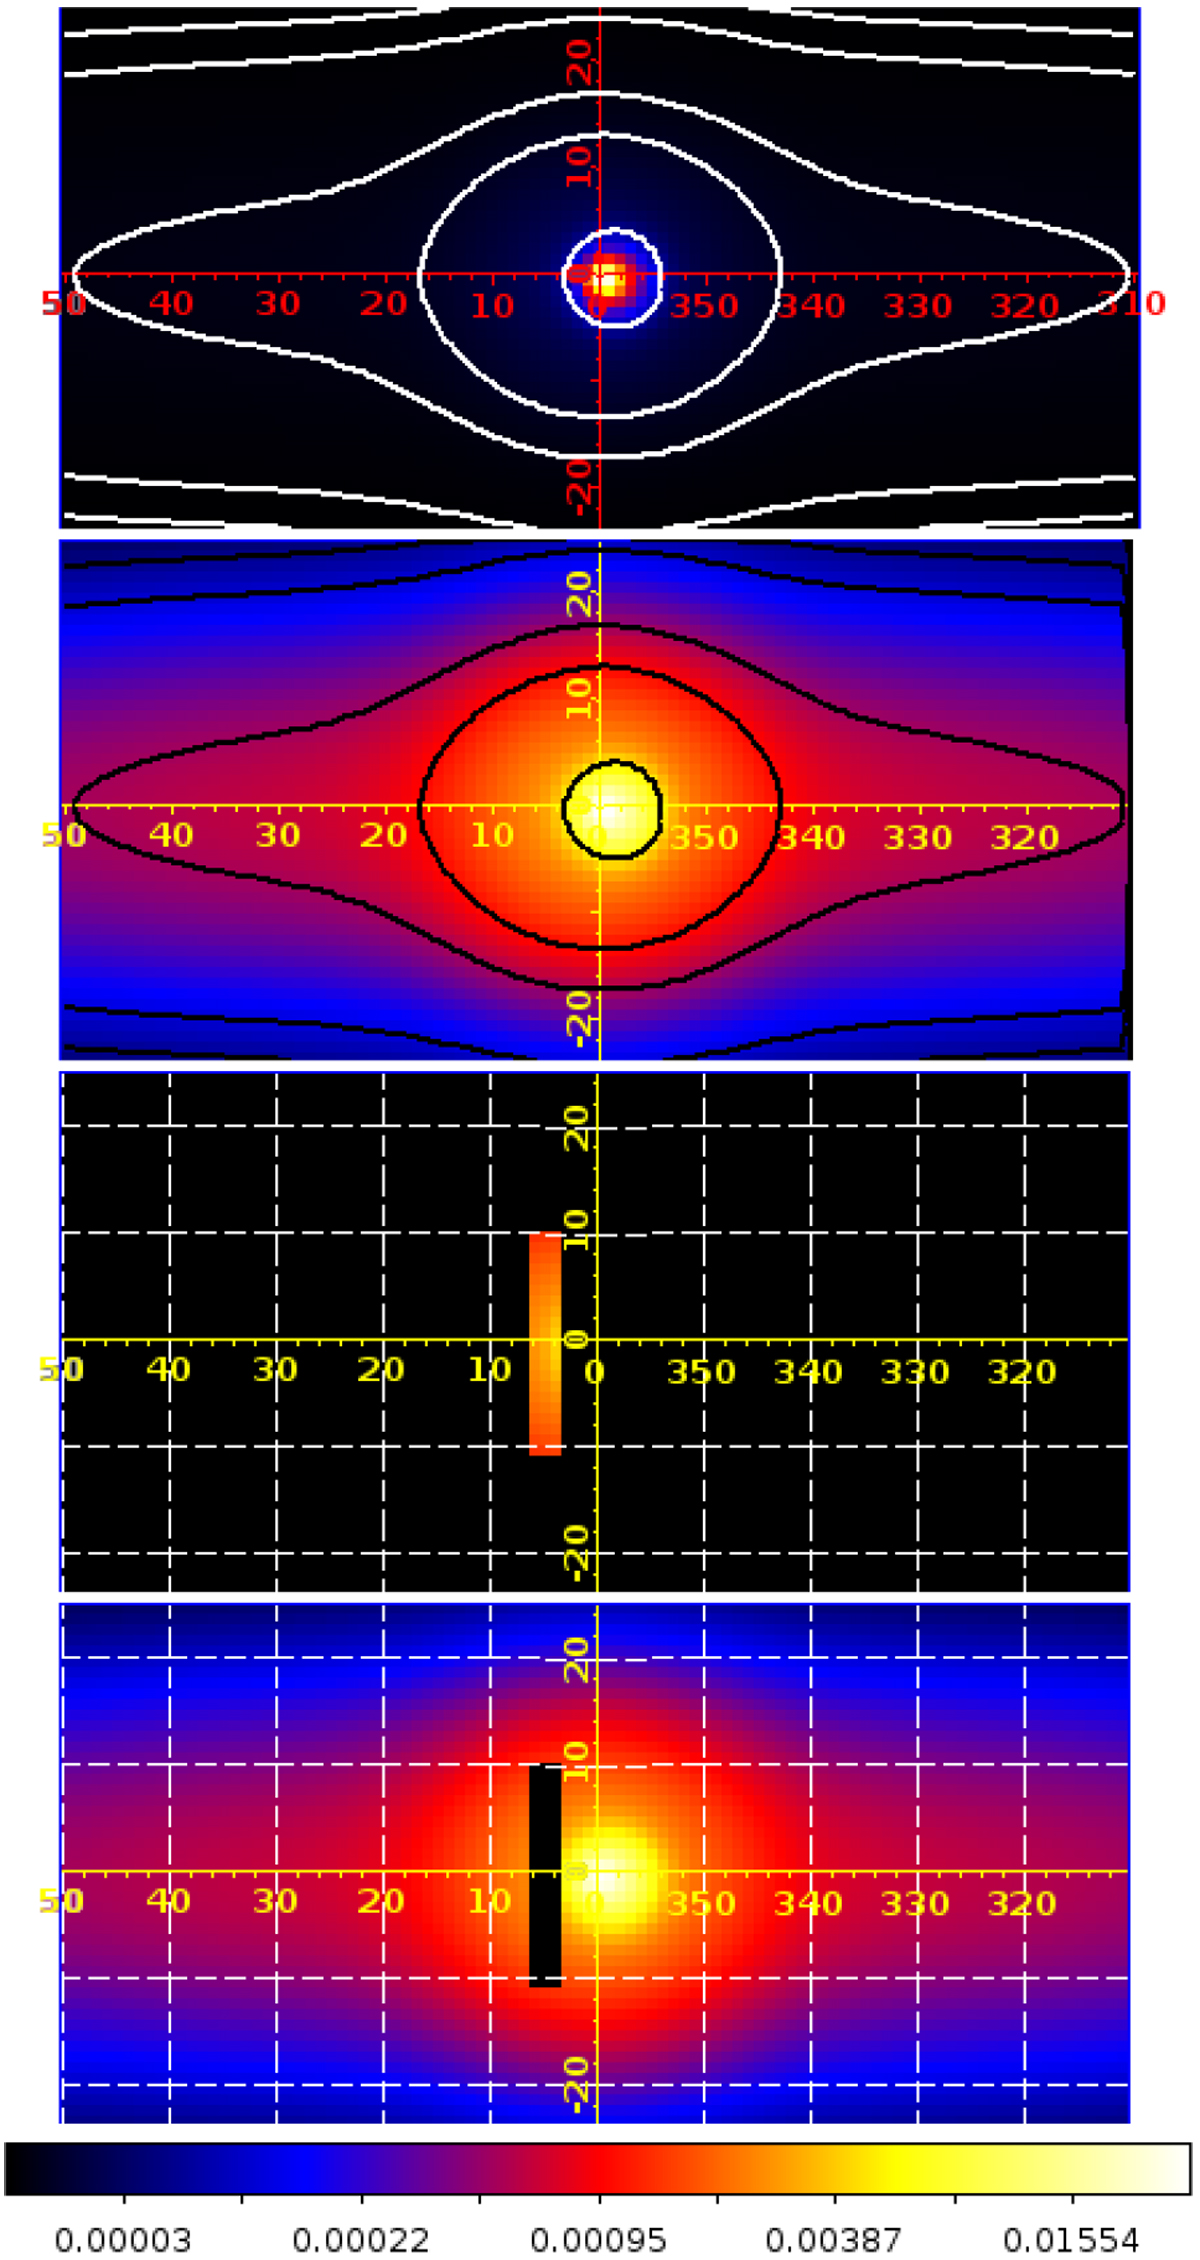
Celestial emission model components for galactic 511 keV radiation. From top to bottom: galactic 511 keV line map as determined in Siegert et al. (2016) in linear scaling; same as shown in the top panel, but in logarithmic scaling to emphasise low surface-brightness regions; exemplary ROI region of Δl × Δb = 3.00° × 21.00° size, centred at l = 4.75°; complementary map, excluding the ROI region. The contours indicate regions in which 20, 50, 80, 98, and 99.7%, respectively, of the total flux is contained (from inside to outside).
Current usage metrics show cumulative count of Article Views (full-text article views including HTML views, PDF and ePub downloads, according to the available data) and Abstracts Views on Vision4Press platform.
Data correspond to usage on the plateform after 2015. The current usage metrics is available 48-96 hours after online publication and is updated daily on week days.
Initial download of the metrics may take a while.