Fig. G.1
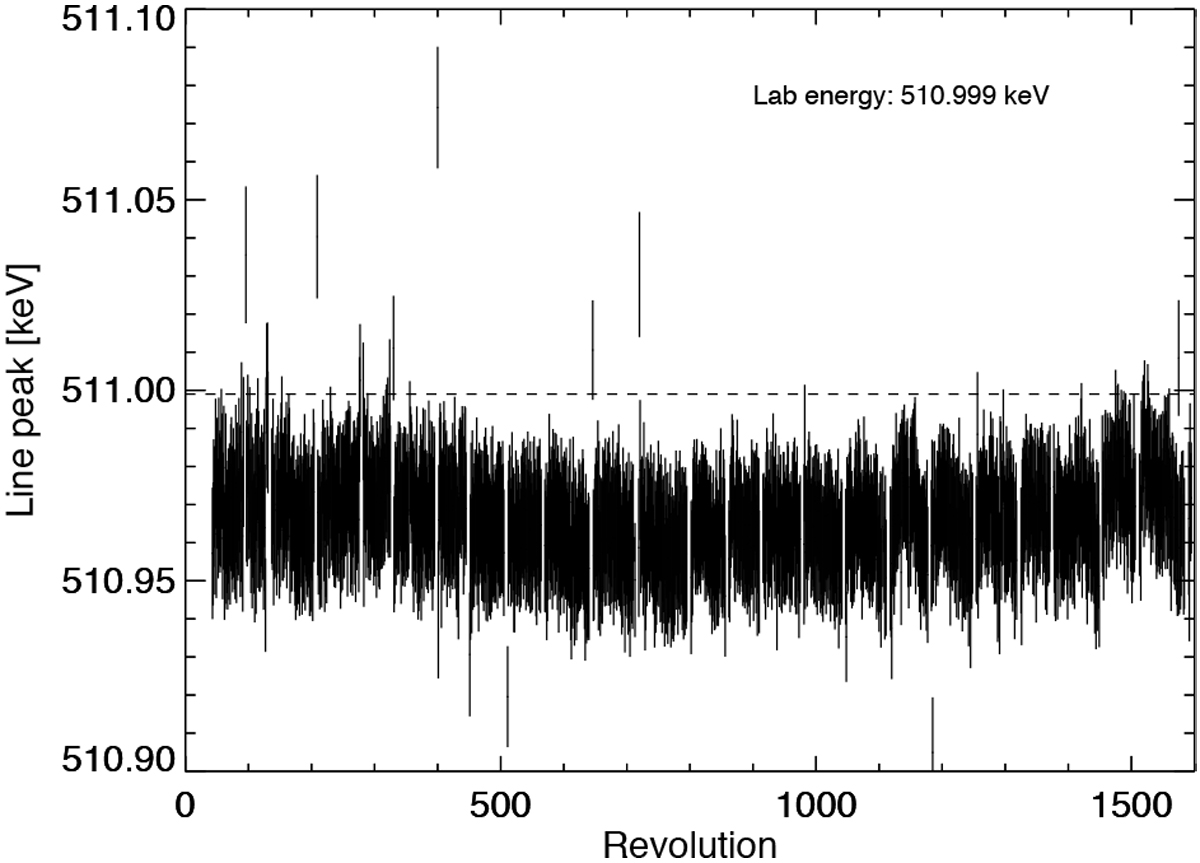
Measured line peak of the SPI background 511 keV line. Each data point (vertical bar, with uncertainty) represents the line peak, determined via Eq. (11), of all detectors in one orbit (revolution) of the INTEGRAL mission. The data set used ranges up to revolution 1279. Outliers, such as around revolution 400 (Epeak= 511.075 ± 0.015 keV) have been excluded from our data set beforehand. The horizontal dashed line marks the laboratory energy.
Current usage metrics show cumulative count of Article Views (full-text article views including HTML views, PDF and ePub downloads, according to the available data) and Abstracts Views on Vision4Press platform.
Data correspond to usage on the plateform after 2015. The current usage metrics is available 48-96 hours after online publication and is updated daily on week days.
Initial download of the metrics may take a while.