Fig. 1
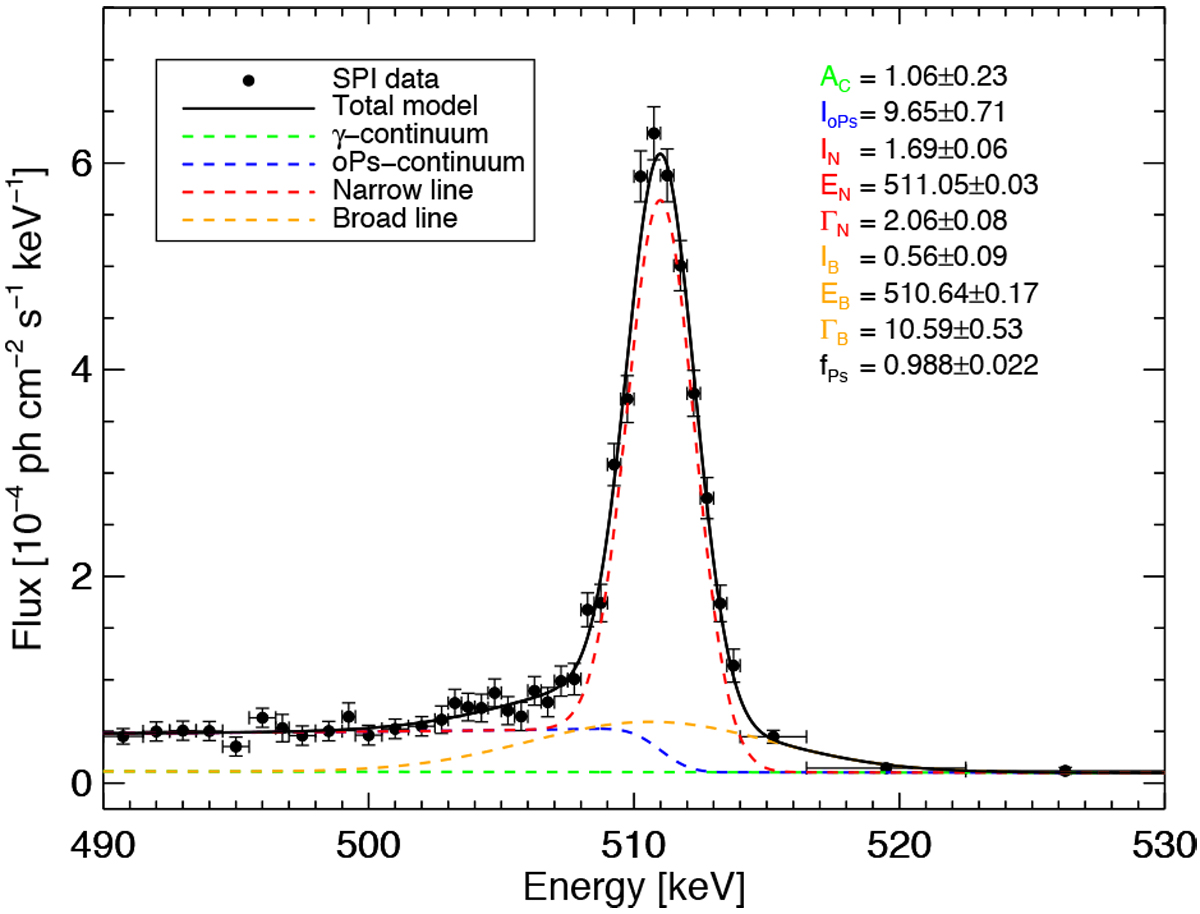
Positron annihilation spectrum of the Galaxy using the best-fit morphology model of Siegert et al. (2016). Shown are the SPI data points in black (≥3σ-bins), and four model components: narrow 511 keV line (red), broad 511 keV line (orange), ortho-positronium continuum (blue), galatic γ-ray continuum (green). The total model is shown as solid black line. The fitted parameters are shown in the legend. The units are 10−5 ph cm−2 s−1 keV−1 for the continuum amplitude AC, 10−3 ph cm−2 s−1 for the line fluxes IN and IB, and the positronium continuum IoPs, and keV for the lines centroids EN and EB, and widths ΓN and ΓB. The positronium fraction fPs is measured to be between 0.97 and 1.00.
Current usage metrics show cumulative count of Article Views (full-text article views including HTML views, PDF and ePub downloads, according to the available data) and Abstracts Views on Vision4Press platform.
Data correspond to usage on the plateform after 2015. The current usage metrics is available 48-96 hours after online publication and is updated daily on week days.
Initial download of the metrics may take a while.