Fig. 4.
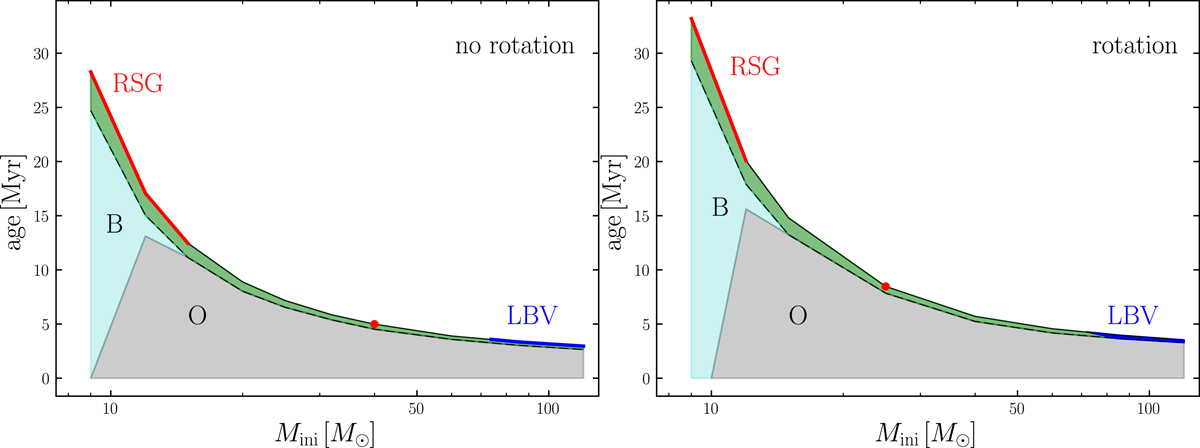
Lifetimes during different evolutionary phases as a function of initial mass for nonrotating (left) and rotating models (right). The upper curve corresponds to the total lifetime and the dashed black curve to the MS lifetime, which is further divided in O-type and B-type stars. The blue regions beyond the MS phase correspond to yellow-blue supergiants, red to red supergiants, and blue to LBV stars.
Current usage metrics show cumulative count of Article Views (full-text article views including HTML views, PDF and ePub downloads, according to the available data) and Abstracts Views on Vision4Press platform.
Data correspond to usage on the plateform after 2015. The current usage metrics is available 48-96 hours after online publication and is updated daily on week days.
Initial download of the metrics may take a while.