Fig. 2.
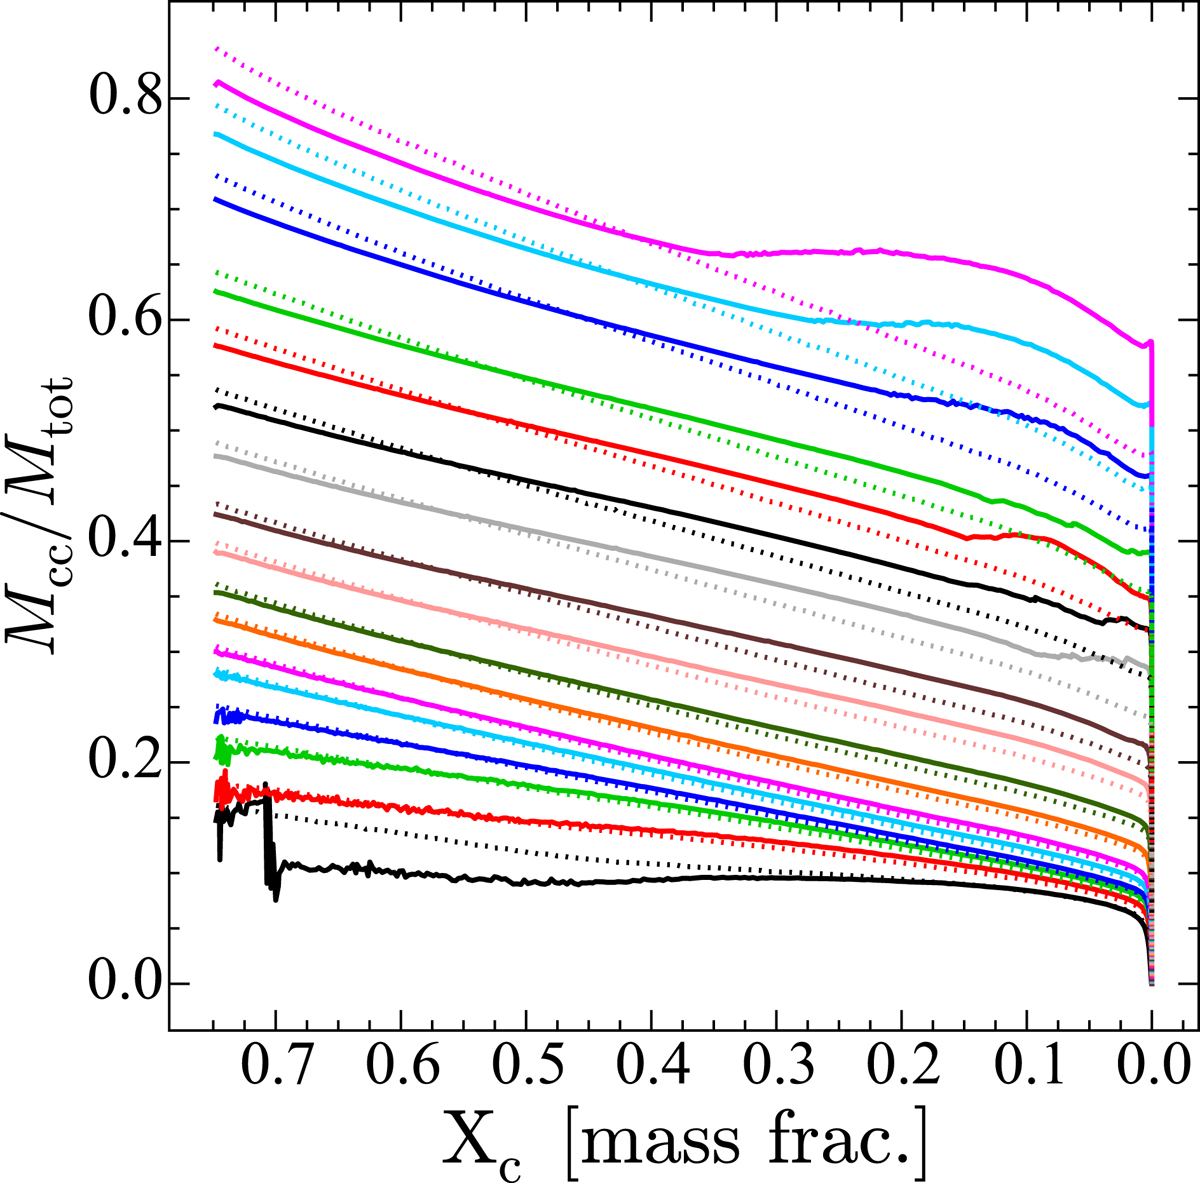
Evolution of the fractional mass of the convective cores during the MS as a function of the mass fraction of hydrogen at the center. The bottom black line is for the 1.7 M⊙ model, and the top magenta line for the 120 M⊙ model. The other intermediate lines show models with initial masses increasing from bottom to top. Solid (dotted) lines correspond to rotating (nonrotating) models.
Current usage metrics show cumulative count of Article Views (full-text article views including HTML views, PDF and ePub downloads, according to the available data) and Abstracts Views on Vision4Press platform.
Data correspond to usage on the plateform after 2015. The current usage metrics is available 48-96 hours after online publication and is updated daily on week days.
Initial download of the metrics may take a while.