Fig. 16.
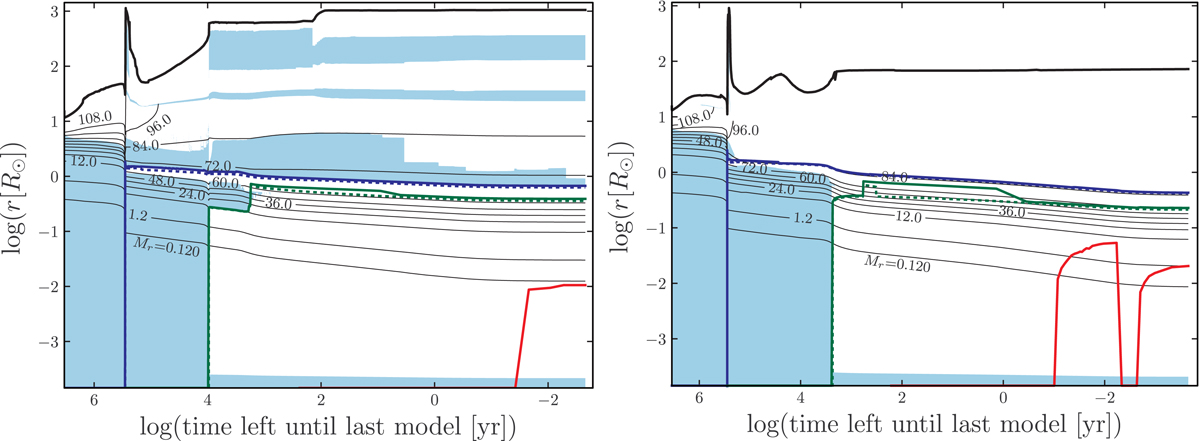
Kippenhahn diagrams for 120 M⊙ models at Z = 0.0004 (left panel) and Z = 0.002 (right panel), showing the evolution of the stellar structure in terms of the distance from the center as a function of time to core collapse. The black line at the top indicates the total radius of the star. The thin black lines followed by a label indicate the radial coordinate of different mass shells inside the star. The blue-shaded areas correspond to convective regions. The solid (dashed) lines correspond to the peak (10%) of the energy generation rate for H burning (blue), He burning (green), and C burning (red).
Current usage metrics show cumulative count of Article Views (full-text article views including HTML views, PDF and ePub downloads, according to the available data) and Abstracts Views on Vision4Press platform.
Data correspond to usage on the plateform after 2015. The current usage metrics is available 48-96 hours after online publication and is updated daily on week days.
Initial download of the metrics may take a while.