Free Access
Fig. 12.
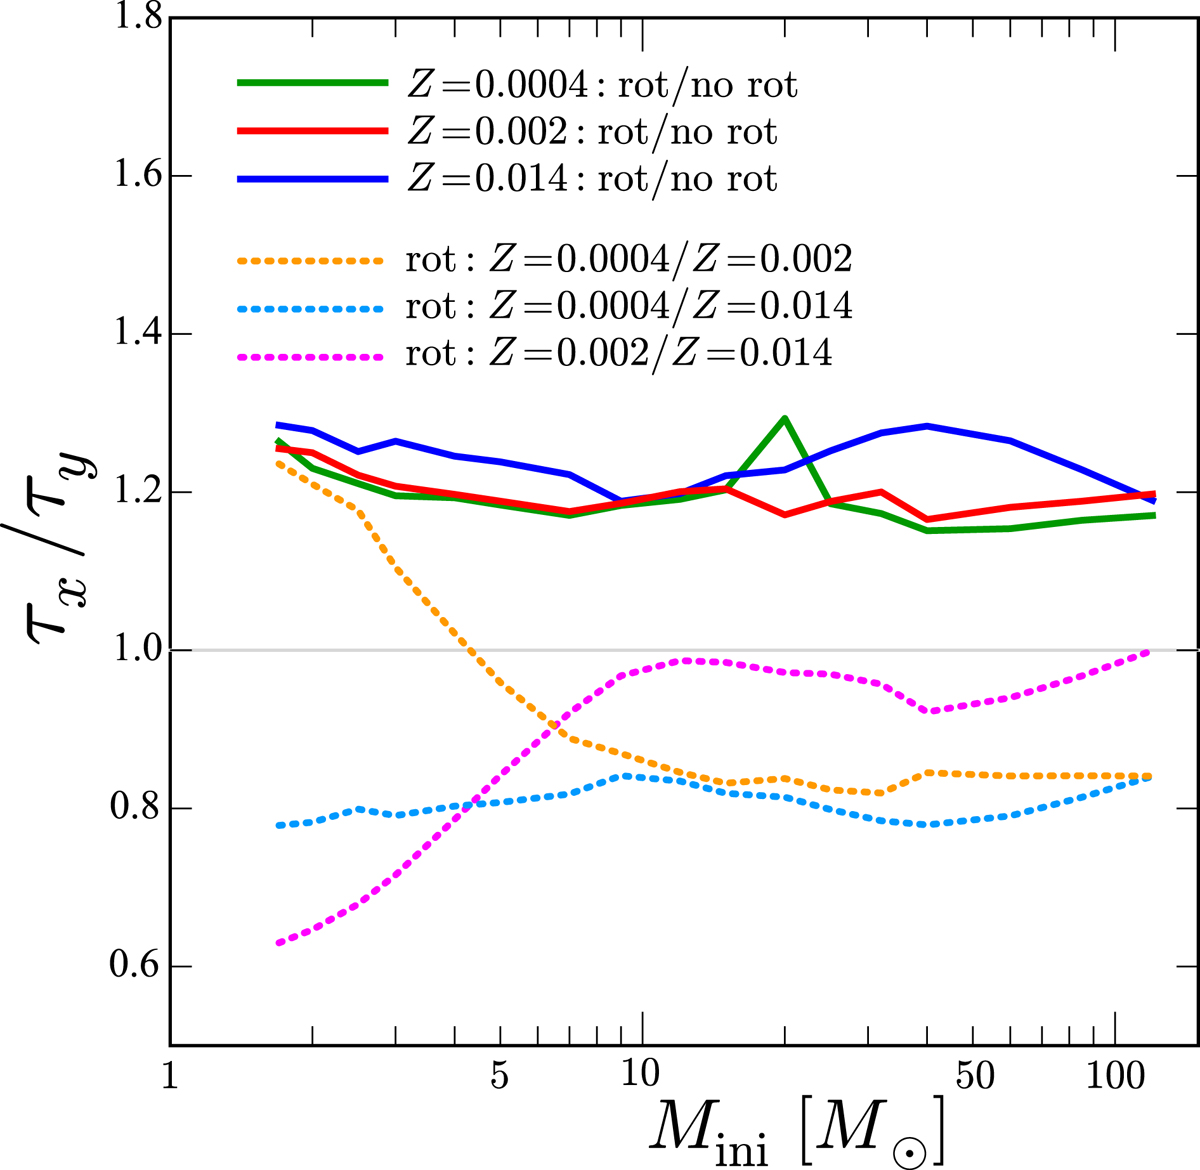
Ratio between the lifetimes of rotating and nonrotating Geneva stellar evolution models for different metallicity grids (solid lines). The dotted lines show the ratio between the lifetime of rotating models at two metallicities. The models at Z = 0.014 are from Paper I and at Z = 0.002 from Paper III.
Current usage metrics show cumulative count of Article Views (full-text article views including HTML views, PDF and ePub downloads, according to the available data) and Abstracts Views on Vision4Press platform.
Data correspond to usage on the plateform after 2015. The current usage metrics is available 48-96 hours after online publication and is updated daily on week days.
Initial download of the metrics may take a while.