Fig. 1.
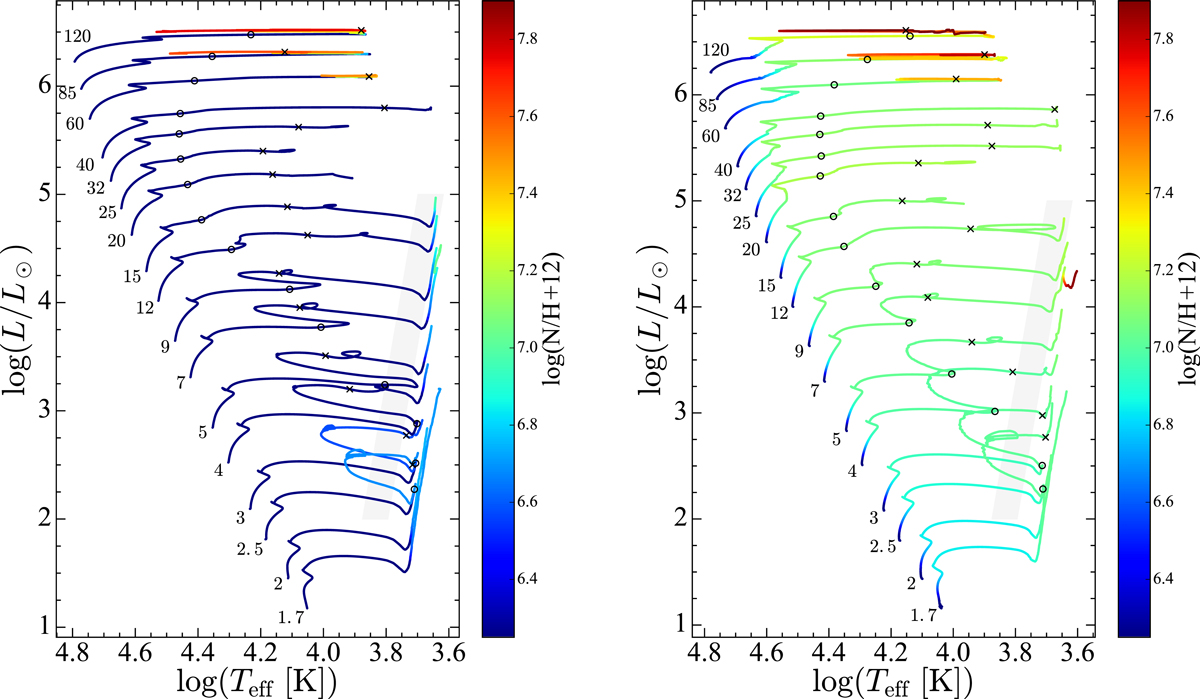
Evolutionary tracks in the theoretical HR diagram for nonrotating (left panel) and rotating models (right panel). Each track is labeled with its initial mass. The beginning (when 0.003 in mass fraction of helium has been burnt at the center) and end of the core He-burning phase are indicated by open circles and crosses, respectively. The Cepheid instability strip is indicated by the light gray region (Tammann et al. 2003). The color scale indicates the surface number abundance of nitrogen on a logarithmic scale where the abundance of hydrogen is 12.
Current usage metrics show cumulative count of Article Views (full-text article views including HTML views, PDF and ePub downloads, according to the available data) and Abstracts Views on Vision4Press platform.
Data correspond to usage on the plateform after 2015. The current usage metrics is available 48-96 hours after online publication and is updated daily on week days.
Initial download of the metrics may take a while.