Fig. 3.
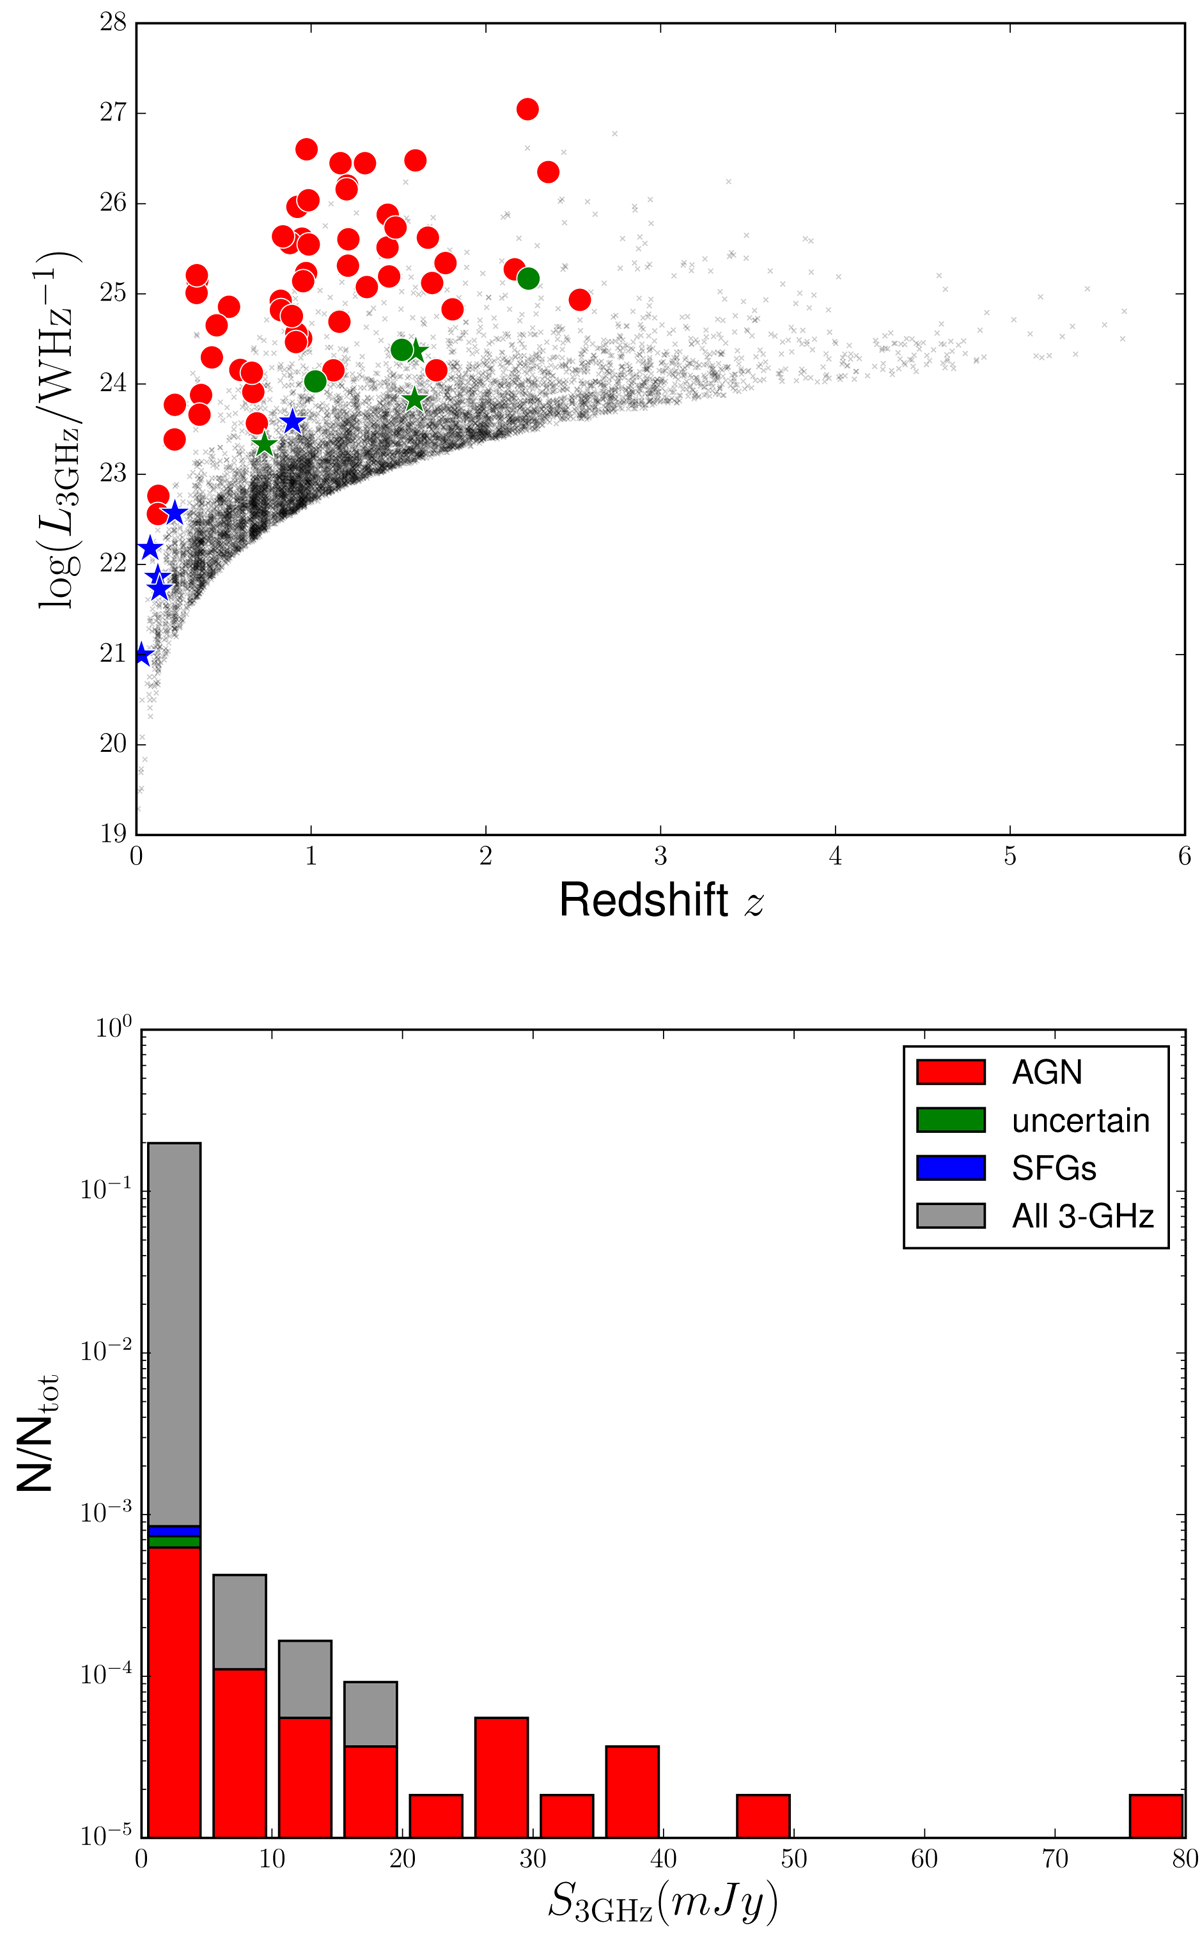
Top: radio luminosity at 3 GHz versus redshift showing the multi-component radio sources compared to the single-component radio sources at 3 GHz. Symbols: red circles are multi-component AGN; blue stars are multi-component SFGs; green circles/stars are for uncertain class, where a circle is for AGN and a star for SFG based on the radio excess (see Sect. 3.1); small black crosses show the single-component radio sources at 3 GHz. Bottom: flux density histogram showing the multi-component objects (AGN in red, uncertain in green and SFGs in blue) relative to the full 3 GHz sample (grey).
Current usage metrics show cumulative count of Article Views (full-text article views including HTML views, PDF and ePub downloads, according to the available data) and Abstracts Views on Vision4Press platform.
Data correspond to usage on the plateform after 2015. The current usage metrics is available 48-96 hours after online publication and is updated daily on week days.
Initial download of the metrics may take a while.