Fig. 2.
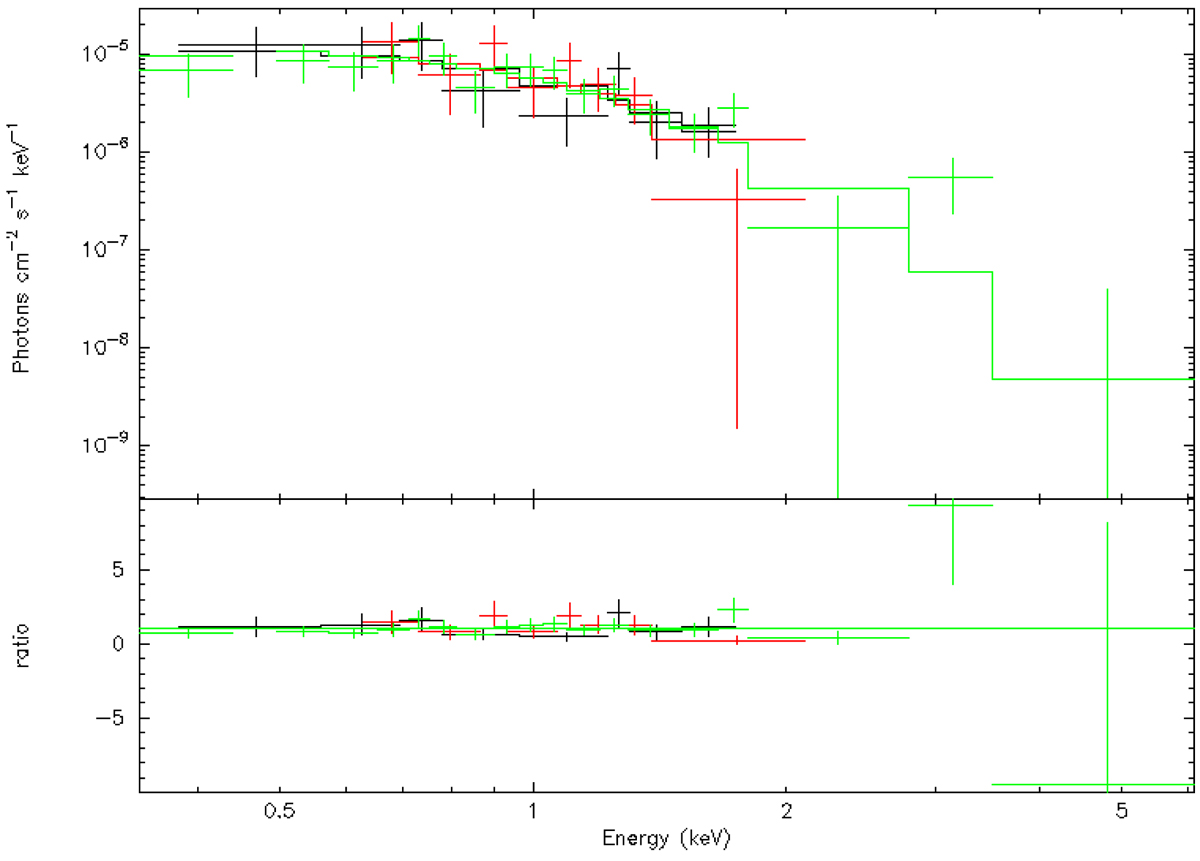
Spectrum of PSR J1909–3744. The data is represented by crosses from MOS1 (black), MOS2 (red) and pn (green) of PSR J1909–3744. Top plot: data fitted with fixed absorption (tbabs) and a hydrogen atmosphere model (nsatmos, the * model in Table 2, green solid line). Bottom plot: same data divided by the model and shown as residuals, in units σ, which is the error bar of each data point.
Current usage metrics show cumulative count of Article Views (full-text article views including HTML views, PDF and ePub downloads, according to the available data) and Abstracts Views on Vision4Press platform.
Data correspond to usage on the plateform after 2015. The current usage metrics is available 48-96 hours after online publication and is updated daily on week days.
Initial download of the metrics may take a while.