Fig. 1.
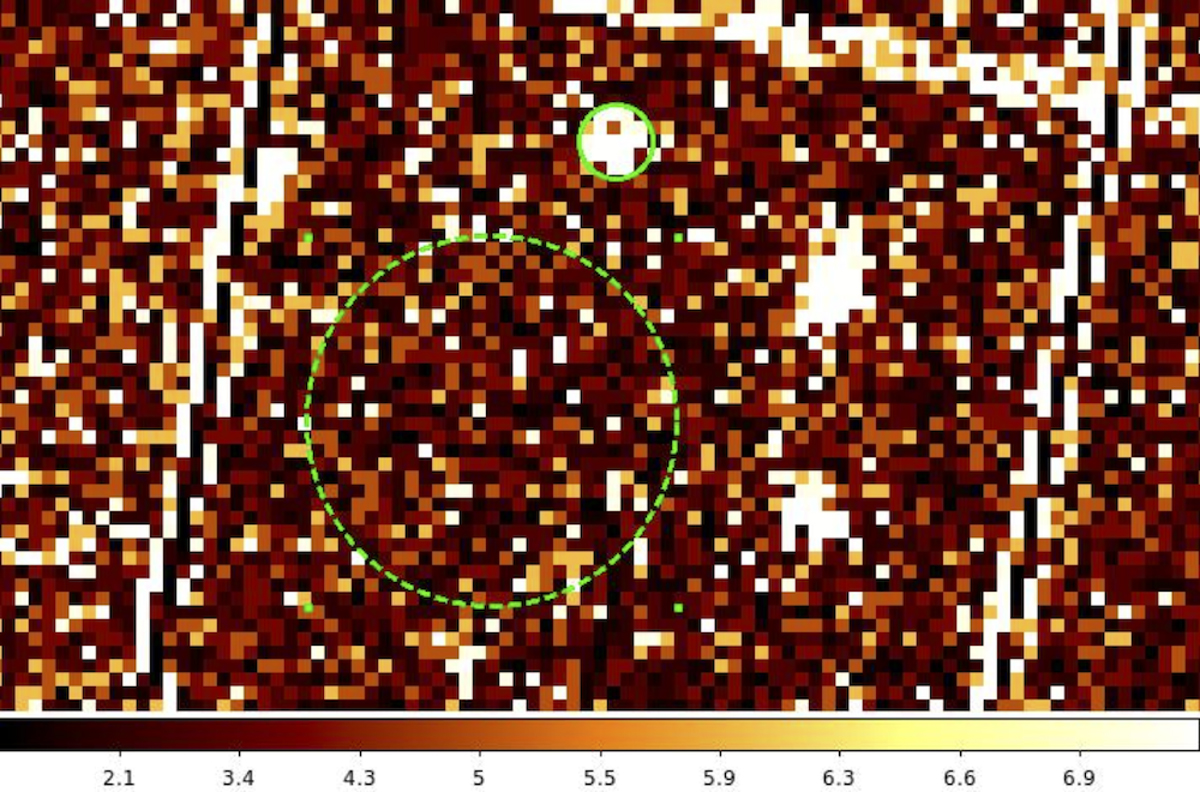
pn image of the region around PSR J1909–3744. The region is shown with a solid circle (green in the colour version, 12″ radius) and the background region, shown with a dashed line (60″ radius). The circles show the radii used for the extraction regions for the pn data. The lighter the colour, the greater the number of counts.
Current usage metrics show cumulative count of Article Views (full-text article views including HTML views, PDF and ePub downloads, according to the available data) and Abstracts Views on Vision4Press platform.
Data correspond to usage on the plateform after 2015. The current usage metrics is available 48-96 hours after online publication and is updated daily on week days.
Initial download of the metrics may take a while.