Fig. 5
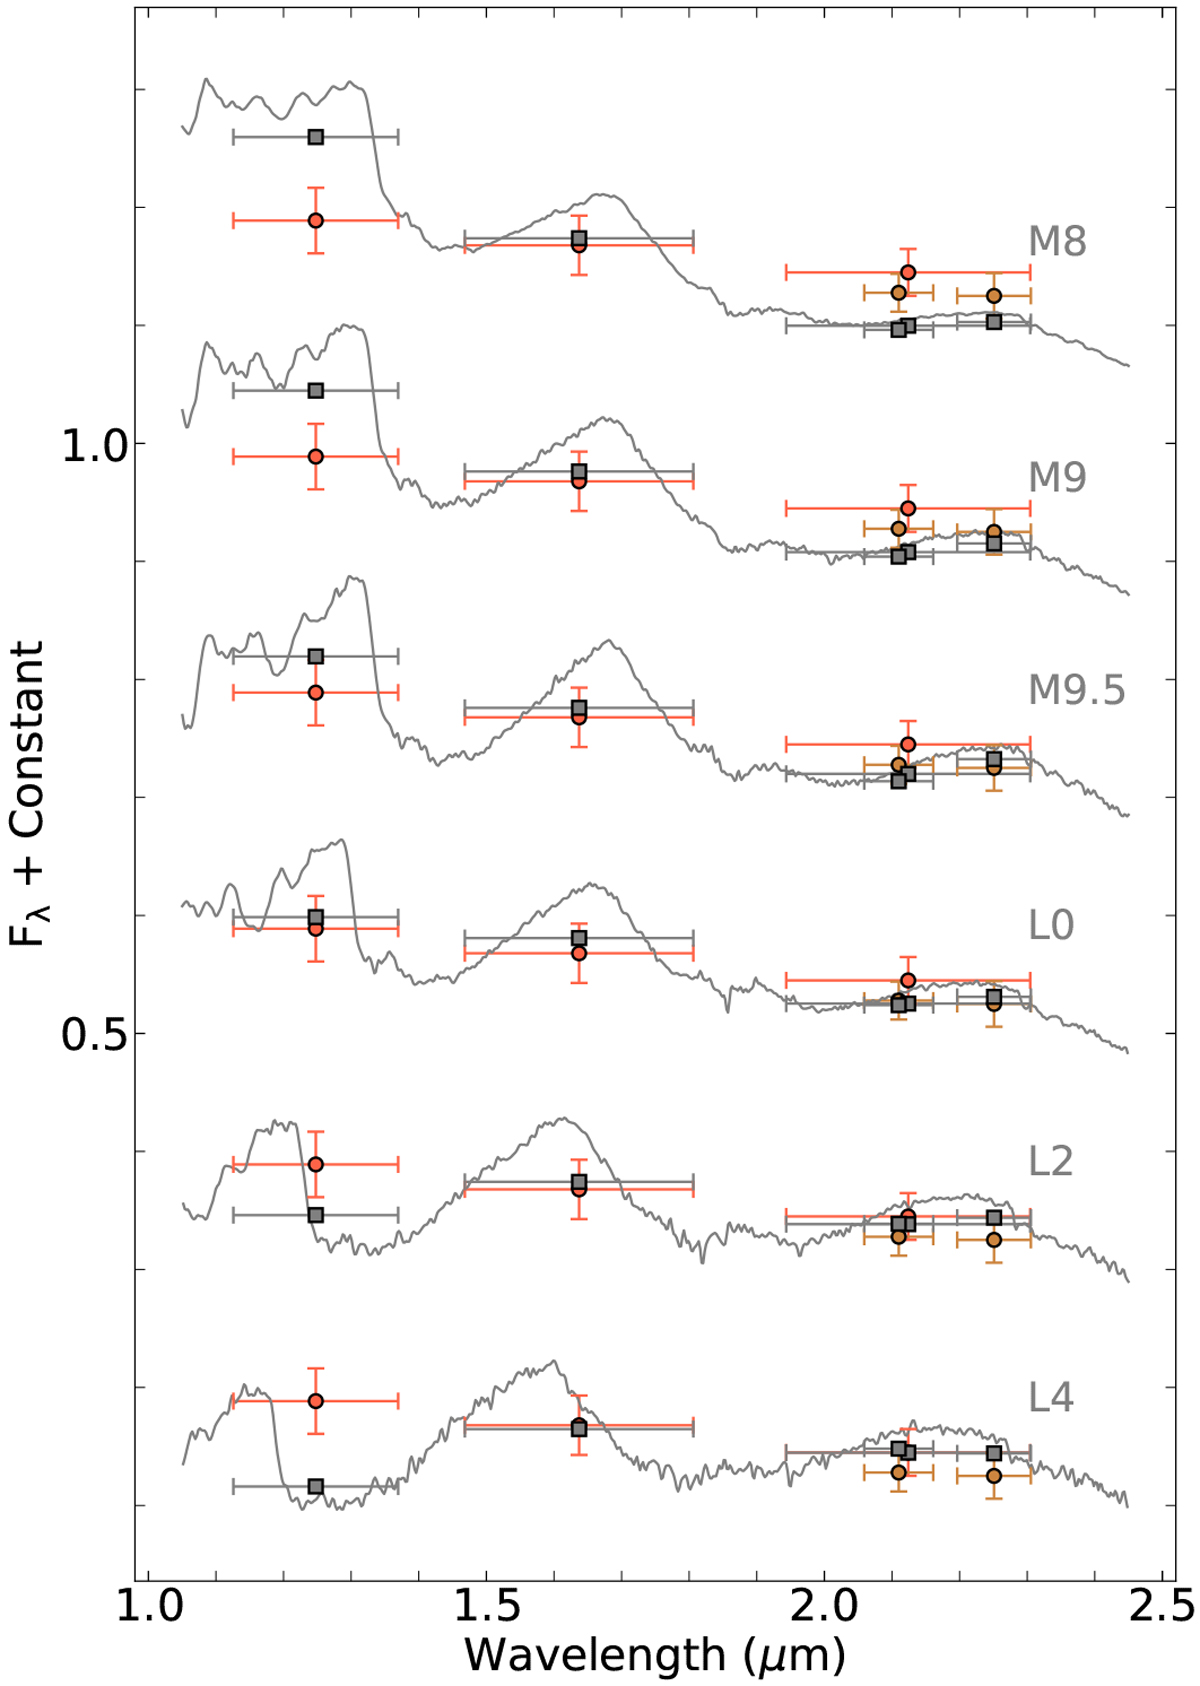
Comparison of the observed photometric data of HIP 79098 (AB)b to (Luhman et al. 2017) templates of different spectral types. NACO JHKs and SPHERE K12 values are shown as red and brown circles, respectively. The grey squares are the result of applying the different filters’ transmission curves to the Luhman models (grey curves). Error bars in the x direction correspond to the FWHM of each corresponding filter.
Current usage metrics show cumulative count of Article Views (full-text article views including HTML views, PDF and ePub downloads, according to the available data) and Abstracts Views on Vision4Press platform.
Data correspond to usage on the plateform after 2015. The current usage metrics is available 48-96 hours after online publication and is updated daily on week days.
Initial download of the metrics may take a while.