Fig. 12.
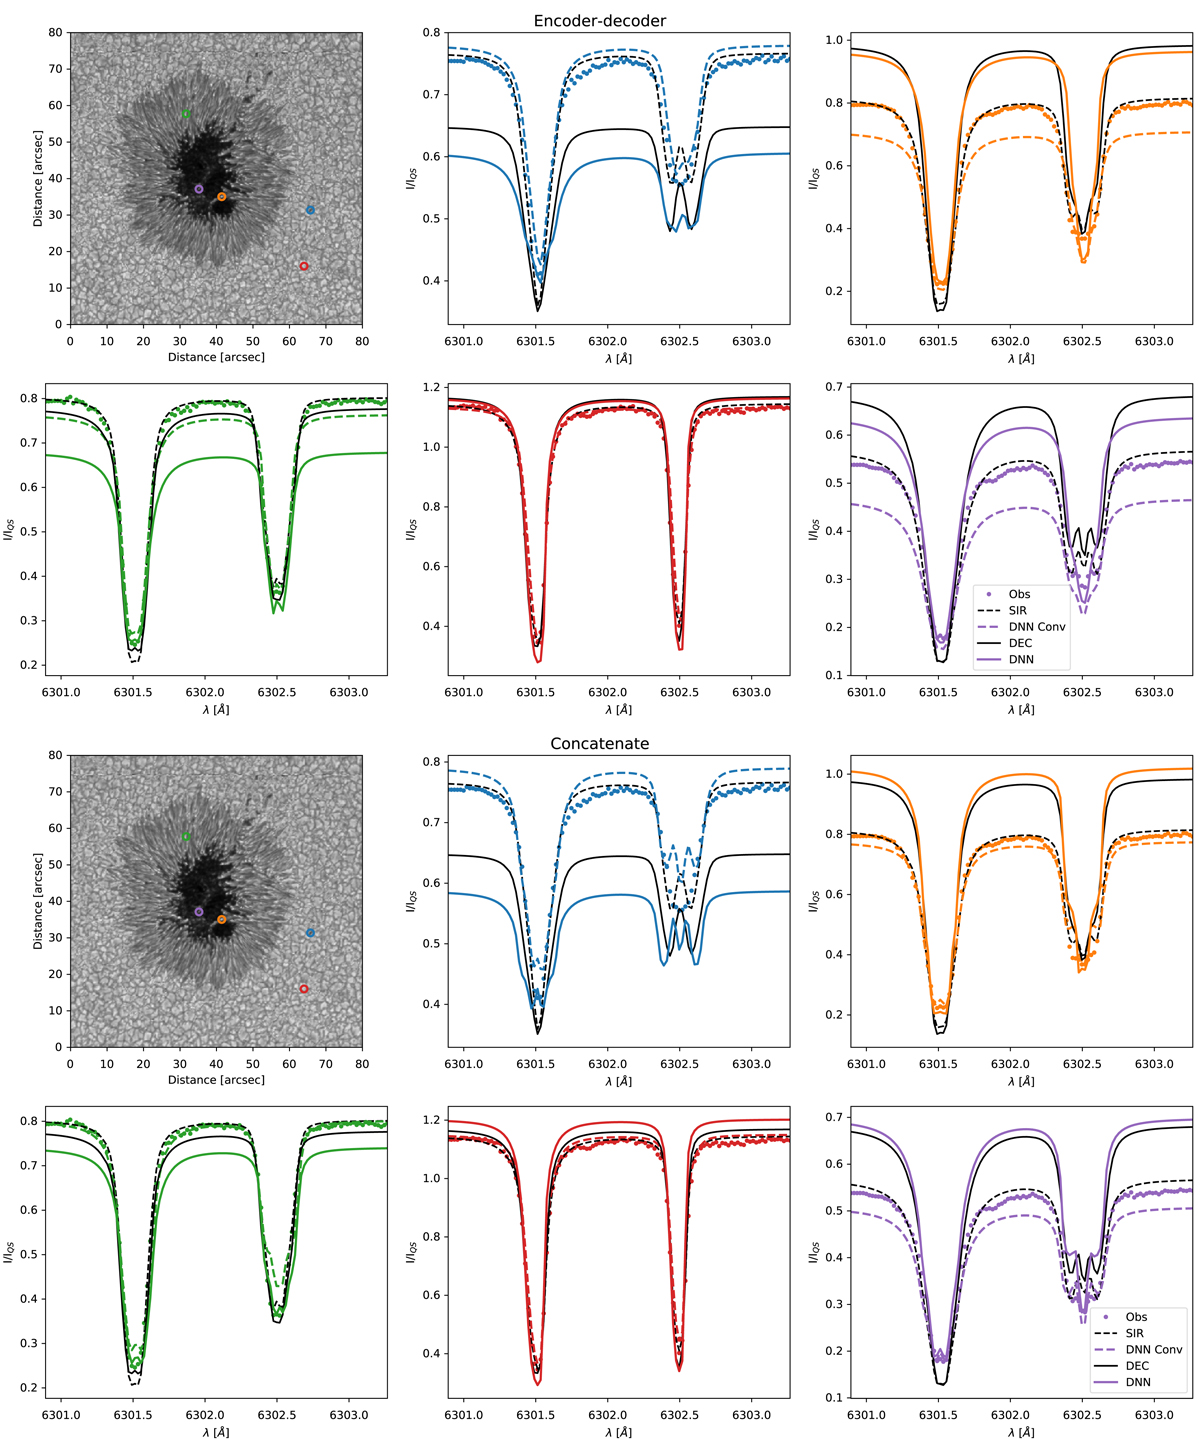
Comparison of Stokes I profiles for all considered inversion approaches in five representative pixels. Upper two rows: results in the encoder-decoder architecture. Lower two rows: concatenate architecture. The result of the SIR inversion is shown in black dashed line and the inversion obtained with the deconvolved data in black solid line. The profile synthesized in the neural approach is shown in solid color line (in different color for each panel) and the result convolved again with the Hinode PSF in dashed color line.
Current usage metrics show cumulative count of Article Views (full-text article views including HTML views, PDF and ePub downloads, according to the available data) and Abstracts Views on Vision4Press platform.
Data correspond to usage on the plateform after 2015. The current usage metrics is available 48-96 hours after online publication and is updated daily on week days.
Initial download of the metrics may take a while.