Fig. A.1.
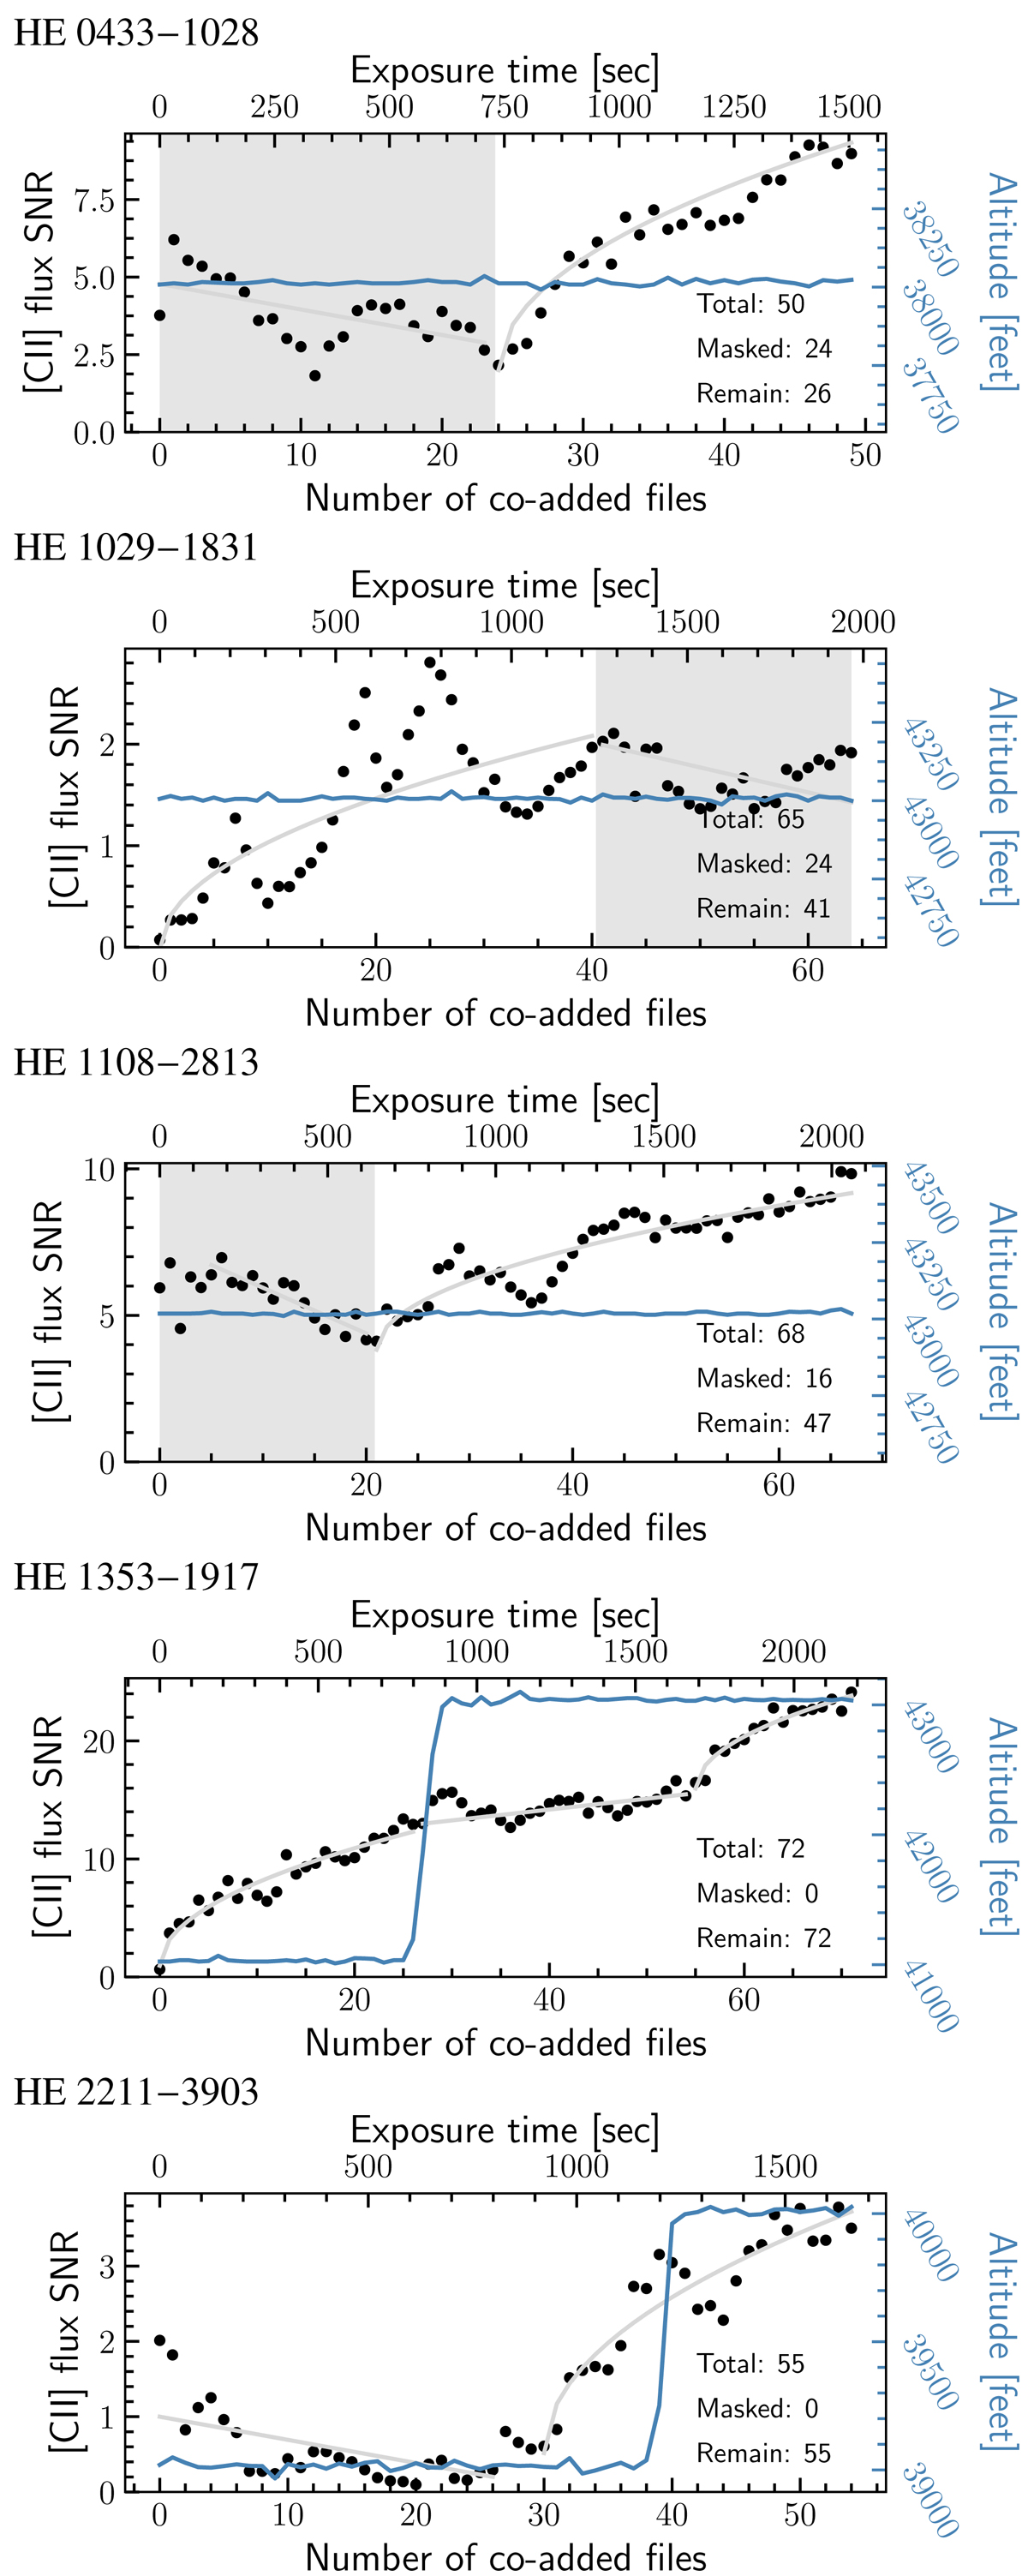
[C II] line S/N as a function of the cumulatively coadded exposures (black circles). The trends (gray lines) are purely subjective and are shown to guide the eye. The shaded areas cover the time windows and associated files that were excluded from the further analysis. The corresponding altitudes of SOFIA are shown as blue lines.
Current usage metrics show cumulative count of Article Views (full-text article views including HTML views, PDF and ePub downloads, according to the available data) and Abstracts Views on Vision4Press platform.
Data correspond to usage on the plateform after 2015. The current usage metrics is available 48-96 hours after online publication and is updated daily on week days.
Initial download of the metrics may take a while.