Fig. 1.
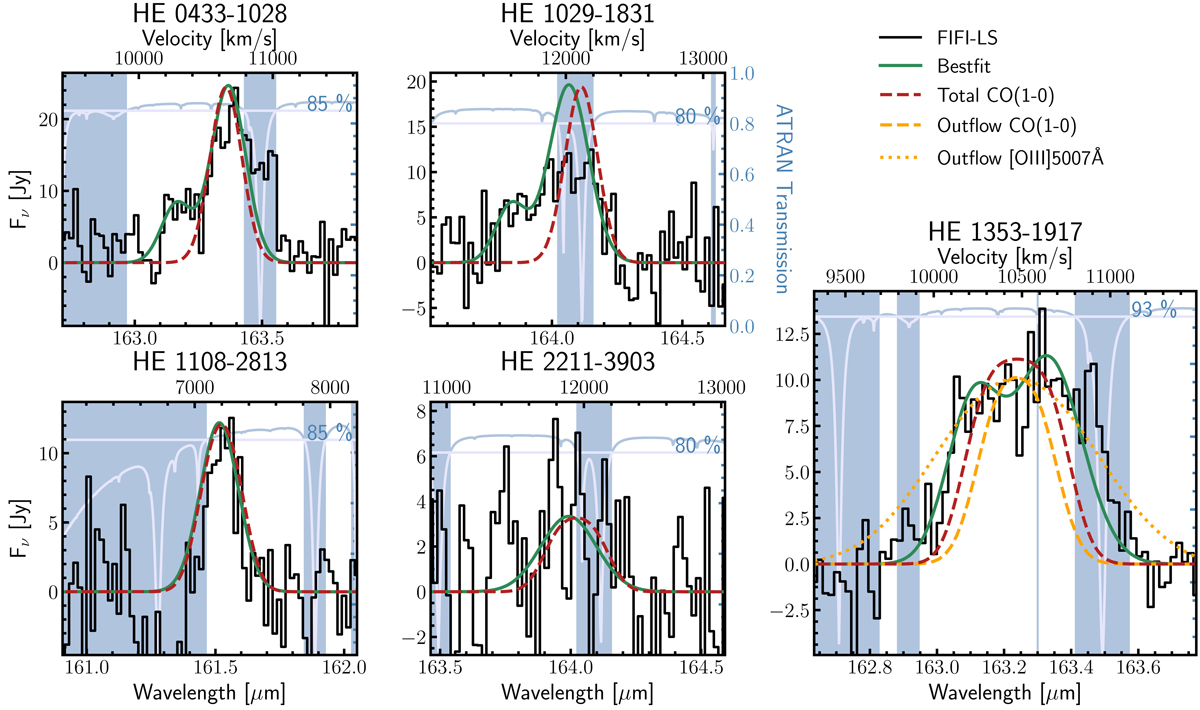
SOFIA/FIFI-LS [C II] spectra (black lines) for each object integrated within 36″ diameter apertures. The CO(1–0) and best-fit Gaussian or double-Gaussian profiles are shown as red dashed and solid green lines, respectively. The CO(1–0) and [O III]5007 Å line profiles of the HE 1353−1917 outflow are shown as orange dashed and dotted lines. The comparison line profiles are degraded to the spectral resolution of SOFIA. The atmospheric transmission curves are shown in blue, and the shaded regions of low transmission are excluded from the analysis.
Current usage metrics show cumulative count of Article Views (full-text article views including HTML views, PDF and ePub downloads, according to the available data) and Abstracts Views on Vision4Press platform.
Data correspond to usage on the plateform after 2015. The current usage metrics is available 48-96 hours after online publication and is updated daily on week days.
Initial download of the metrics may take a while.