Fig. 2.
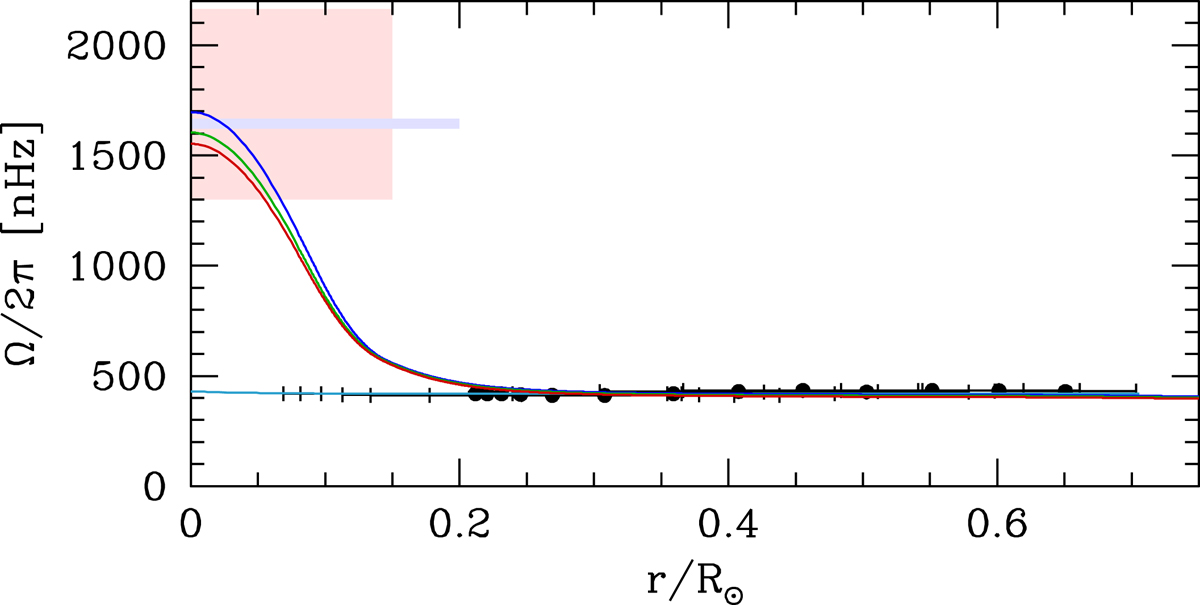
Rotation profiles for solar models computed with different initial rotation velocities and disc lifetimes. Blue, green, and red continuous lines correspond to the fast, moderate, and slow rotating models shown in Fig. 1. The light blue line indicates the model computed with the revised prescription of Fuller et al. (2019). Black dots correspond to the internal rotation in the solar radiative zone as deduced from p-modes (Couvidat et al. 2003). The red and blue regions indicate the mean rotation rate in the solar core corresponding to the detections of g-modes reported by García et al. (2007) and Fossat et al. (2017), respectively.
Current usage metrics show cumulative count of Article Views (full-text article views including HTML views, PDF and ePub downloads, according to the available data) and Abstracts Views on Vision4Press platform.
Data correspond to usage on the plateform after 2015. The current usage metrics is available 48-96 hours after online publication and is updated daily on week days.
Initial download of the metrics may take a while.