Fig. 1.
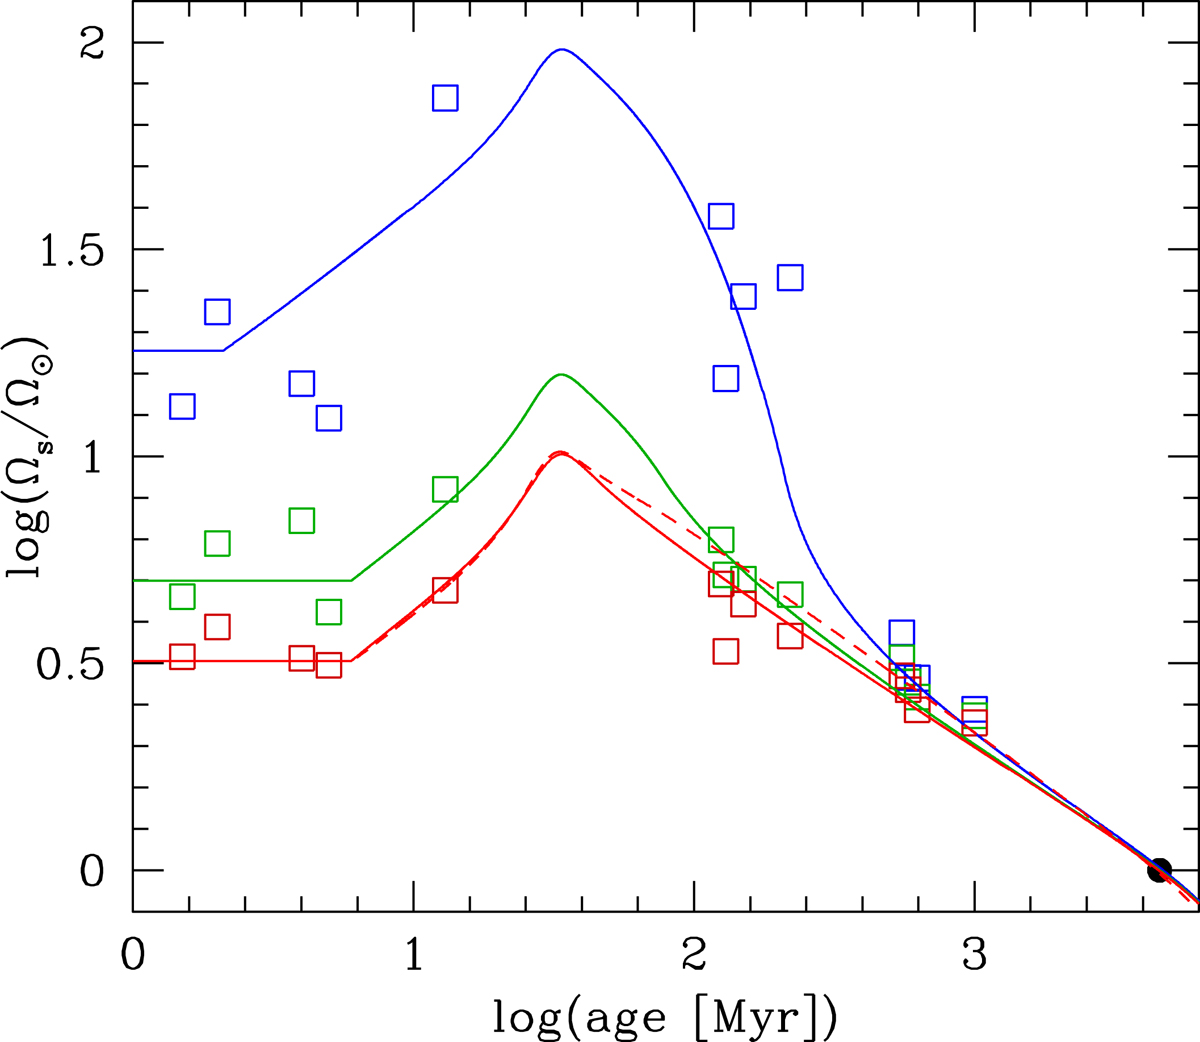
Surface angular velocity Ωs as a function of age for solar models. Blue, green, and red lines indicate models of fast, moderate, and slow rotators, respectively. Open symbols show observations of surface rotation rates in open clusters taken from Table 1 of Gallet & Bouvier (2015), with blue, green, and red symbols indicating the 90th, 50th, and 25th rotational percentiles, respectively. The black dot indicates the surface rotation of the Sun. Continuous lines refer to models computed with the surface braking law of Matt et al. (2015), while the dashed red line corresponds to a model computed with the braking law of Krishnamurthi et al. (1997).
Current usage metrics show cumulative count of Article Views (full-text article views including HTML views, PDF and ePub downloads, according to the available data) and Abstracts Views on Vision4Press platform.
Data correspond to usage on the plateform after 2015. The current usage metrics is available 48-96 hours after online publication and is updated daily on week days.
Initial download of the metrics may take a while.