Fig. 5.
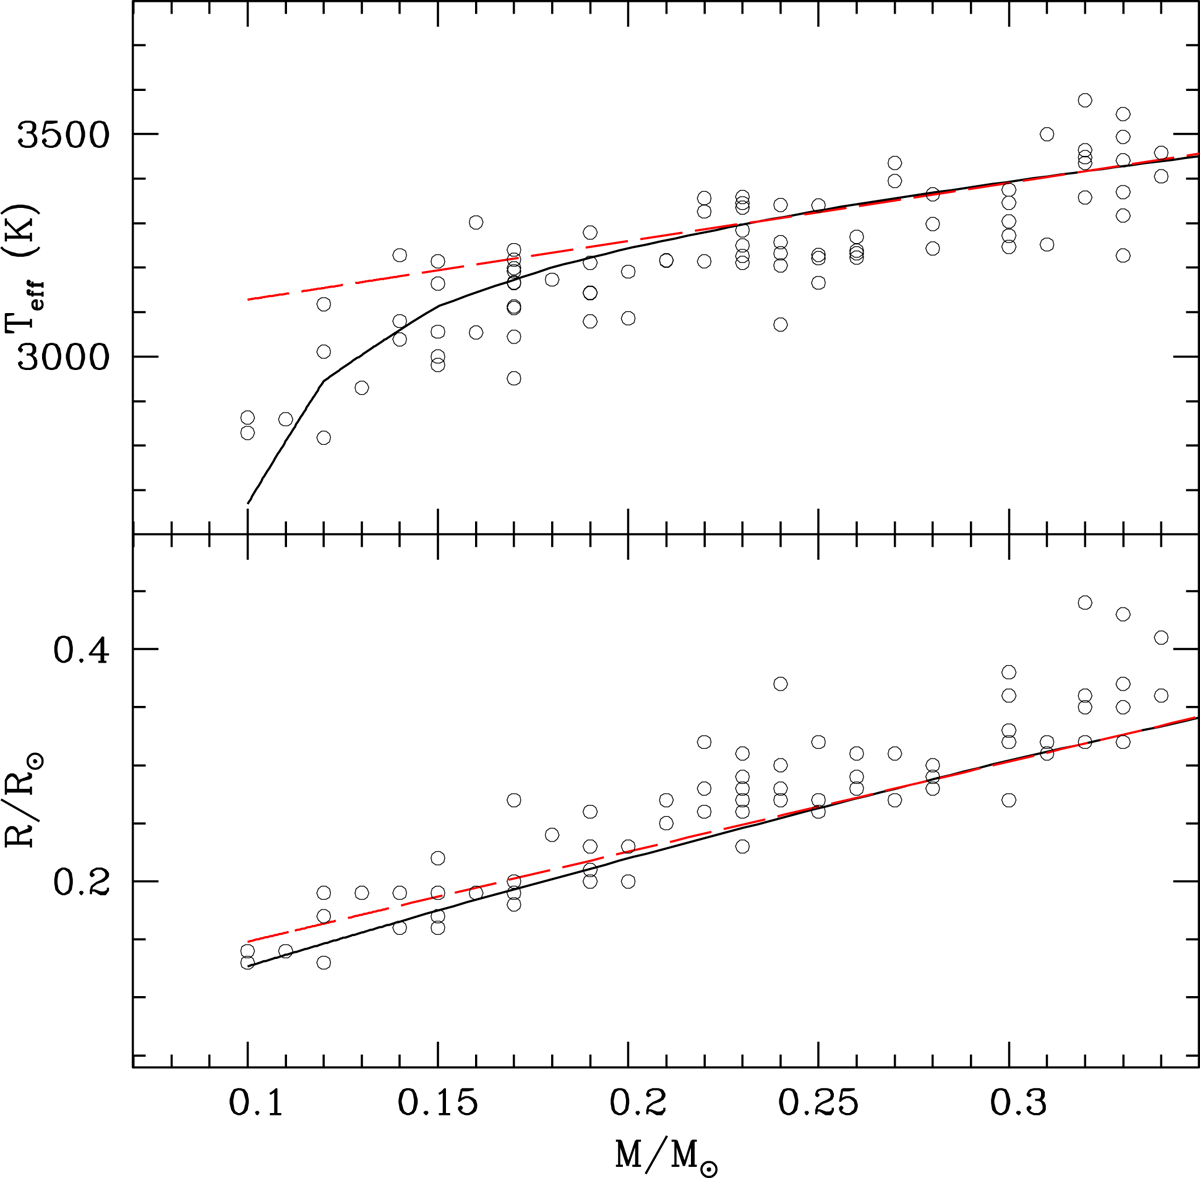
Upper panel: M − Teff relation around M = 0.2 M⊙ for the M15 sample (open circles) and the 10 Gyr BaSTI-IAC models with [Fe/H] = 0.06. Lower panel: same as the upper panel, but for the M − R relation. Dashed red lines in both panels denote linear fits to the model results in the mass range between 0.35 and 0.25 M⊙ (see text for details).
Current usage metrics show cumulative count of Article Views (full-text article views including HTML views, PDF and ePub downloads, according to the available data) and Abstracts Views on Vision4Press platform.
Data correspond to usage on the plateform after 2015. The current usage metrics is available 48-96 hours after online publication and is updated daily on week days.
Initial download of the metrics may take a while.