Fig. 3
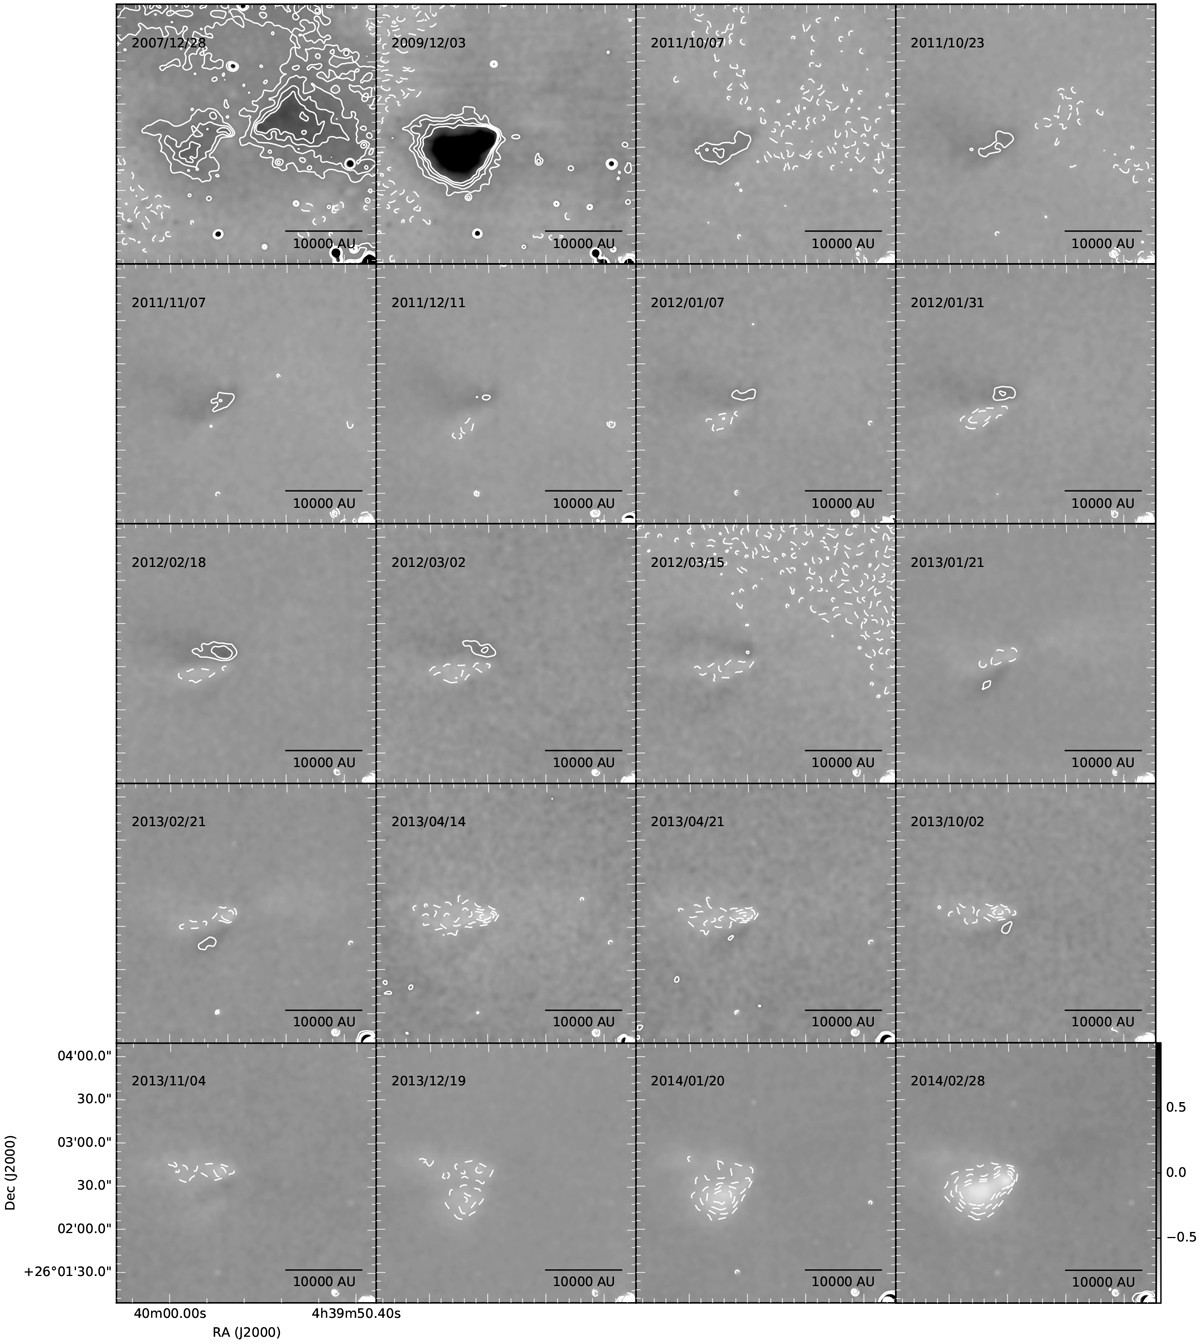
Observations with the average image of L1527 subtracted out, December 2007–April 2014 displayed as inverse grayscale. The contour levels are −0.45, −0.35, −0.25, −0.15, 0.15, 0.25, 0.35, 0.45. Black areas are regions where the emission is brighter than the average and white areas are regions where the emission is fainter than the average. In this set of images the rotational character of the eastern lobe becomes more clear as the black and white flip from December 2011 to February 2013. The color bar shown in the lower right panel is in units of MJy sr−1.
Current usage metrics show cumulative count of Article Views (full-text article views including HTML views, PDF and ePub downloads, according to the available data) and Abstracts Views on Vision4Press platform.
Data correspond to usage on the plateform after 2015. The current usage metrics is available 48-96 hours after online publication and is updated daily on week days.
Initial download of the metrics may take a while.