Free Access
Fig. 7.
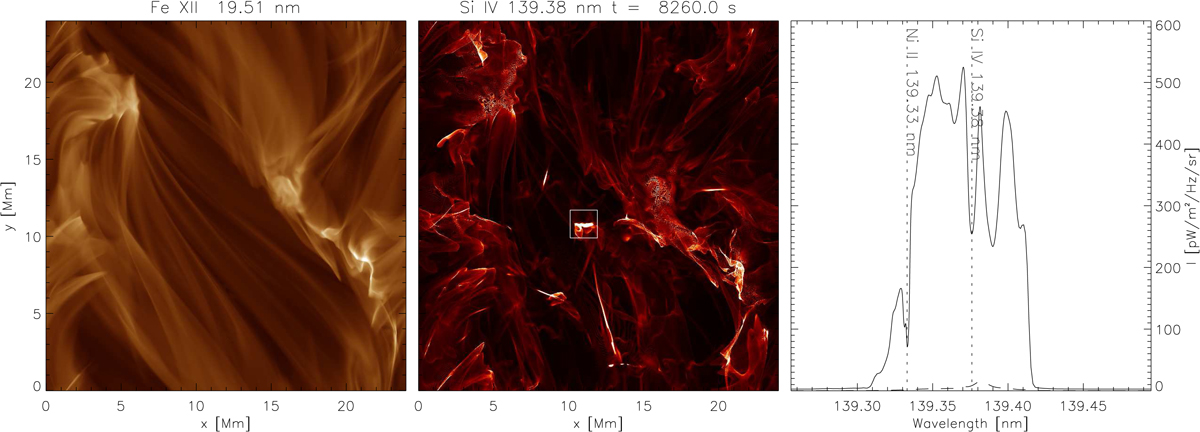
Fe XII 19.5 nm and Si IV 139.376 nm line total line intensities as well as the line profile of the Si IV line (where the full line shows the profile of the UV burst and the dashed line represents the average spectrum). The location of the UV burst is indicated by the box in the central panel.
Current usage metrics show cumulative count of Article Views (full-text article views including HTML views, PDF and ePub downloads, according to the available data) and Abstracts Views on Vision4Press platform.
Data correspond to usage on the plateform after 2015. The current usage metrics is available 48-96 hours after online publication and is updated daily on week days.
Initial download of the metrics may take a while.