Fig. 6.
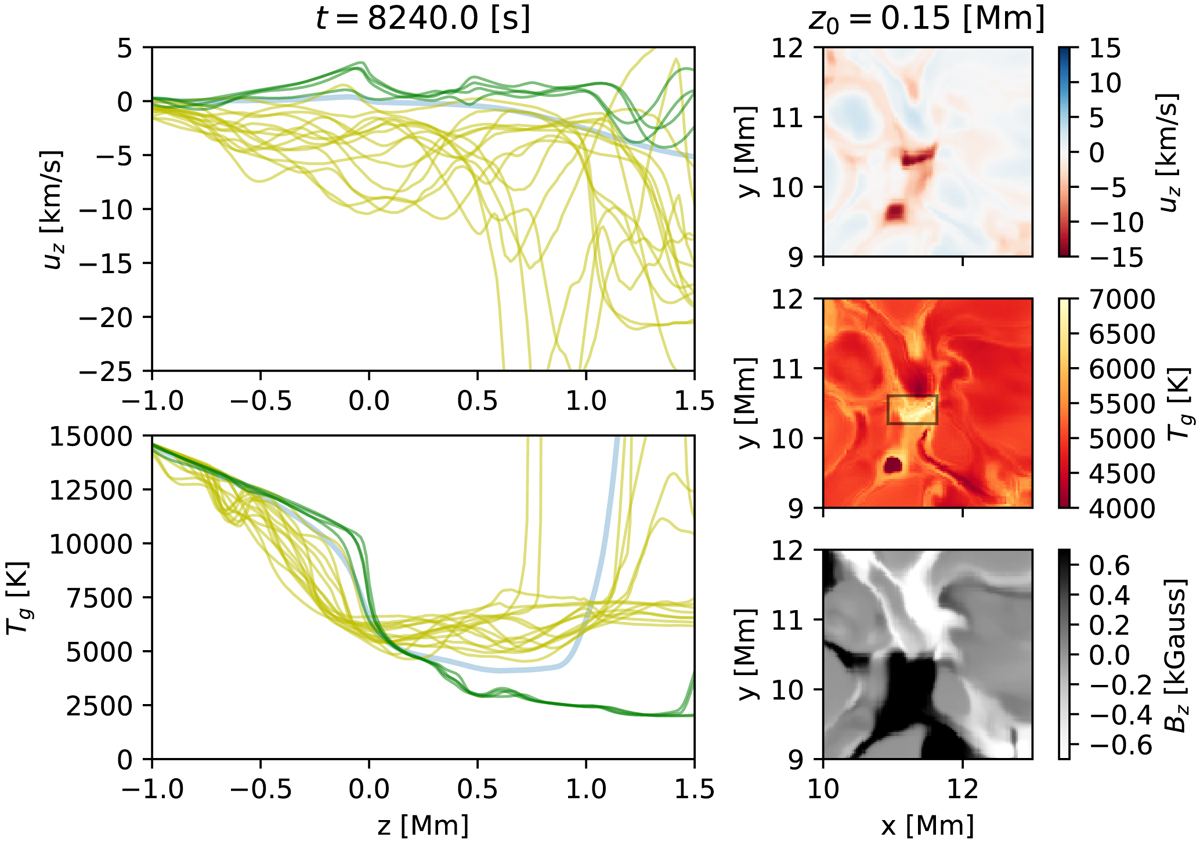
Velocity, temperature, and field strength in the xy-plane z = 150 km above the photosphere (rightmost three panels) in the vicinity of the current sheet that generated the EB described in the text. The current sheet is located in the center of the small box shown in the center of the right central panel. Two leftmost panels: yellow lines: vertical velocity and temperature as functions of height in vertical columns in this small box, averaged over tiles of 150 km (5 × 5 grid zones). Green lines: average of the same variables some distance away from the current sheet, near [x, y] = [10, 9] Mm. Blue lines: average velocity and temperature as a function of height in the entire computational domain.
Current usage metrics show cumulative count of Article Views (full-text article views including HTML views, PDF and ePub downloads, according to the available data) and Abstracts Views on Vision4Press platform.
Data correspond to usage on the plateform after 2015. The current usage metrics is available 48-96 hours after online publication and is updated daily on week days.
Initial download of the metrics may take a while.