Fig. 5.
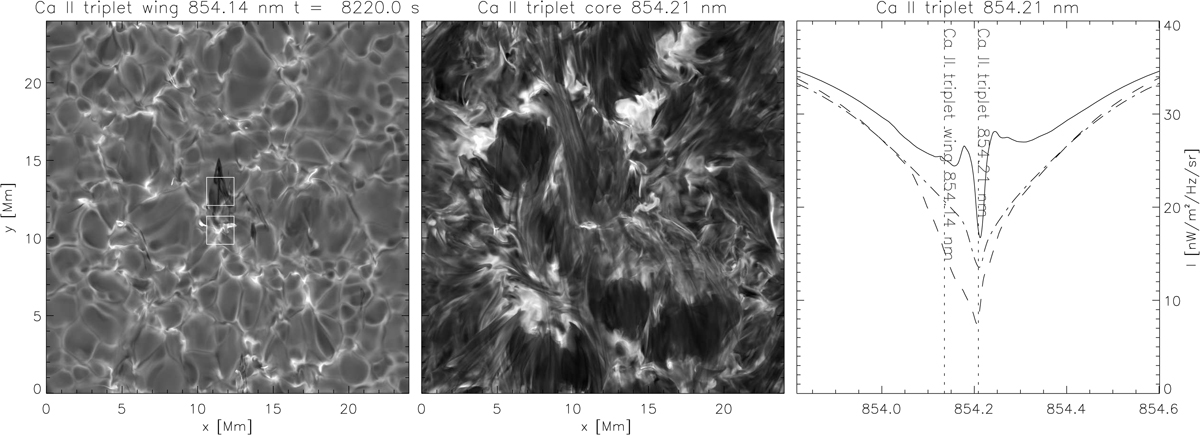
Ca II 854.2 nm line filtergrams showing the blue line wing and line core, as well as the line profile, at the time of a small cool surge. Right panel: line profiles for the EB region (solid line), the cool surge (dashed line), and the average spectrum (dash-dotted line). The EB and cool surge regions we used to construct the profiles are indicated by the boxes in the left panel.
Current usage metrics show cumulative count of Article Views (full-text article views including HTML views, PDF and ePub downloads, according to the available data) and Abstracts Views on Vision4Press platform.
Data correspond to usage on the plateform after 2015. The current usage metrics is available 48-96 hours after online publication and is updated daily on week days.
Initial download of the metrics may take a while.