Fig. 4.
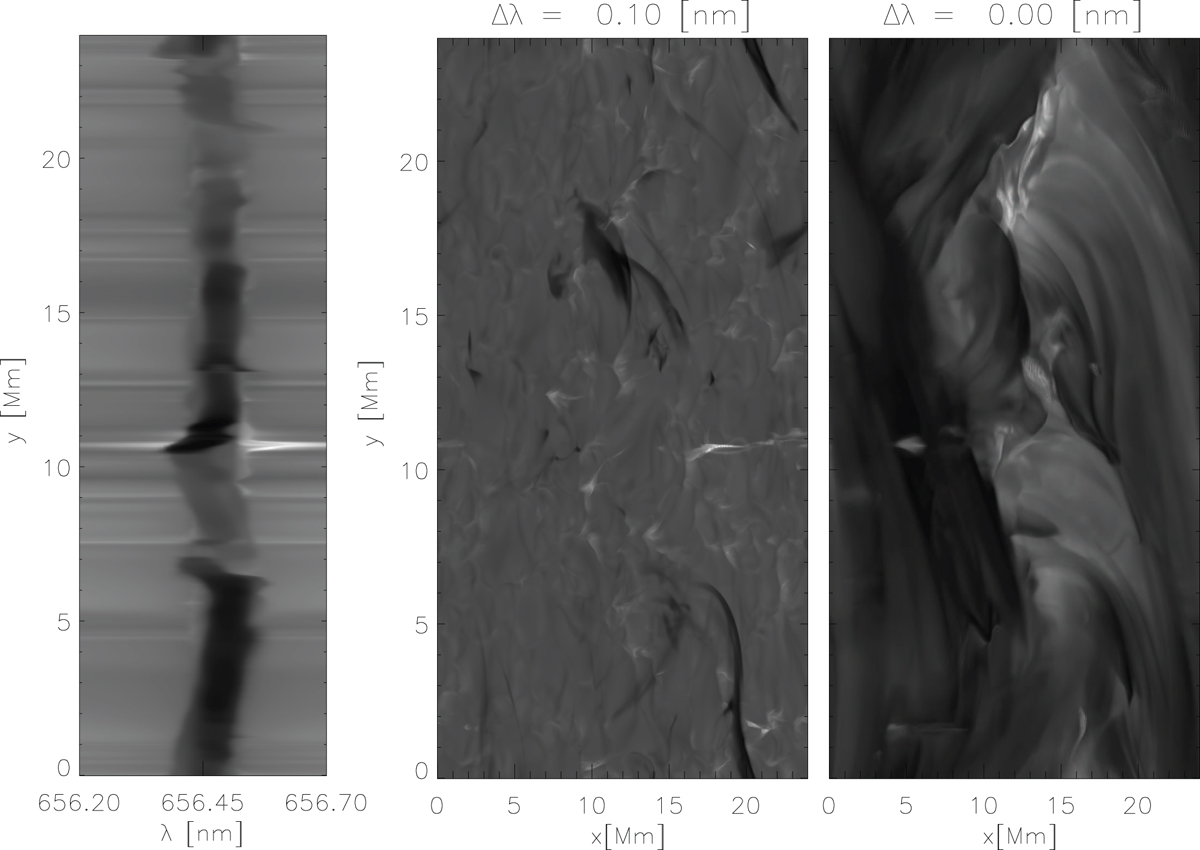
Hα spectroheliograms at +0.1 nm and at line center (center and right panels, respectively) at a viewing angle of μ = 0.5. The EB is located at x = 17 Mm. Because of the projection effect of looking from the side, this corresponds to x = 11 when viewed from directly above. The line profile over the EB, shown in the left panel, is located at [x, y] = [17, 11] Mm and is evident in the line wings.
Current usage metrics show cumulative count of Article Views (full-text article views including HTML views, PDF and ePub downloads, according to the available data) and Abstracts Views on Vision4Press platform.
Data correspond to usage on the plateform after 2015. The current usage metrics is available 48-96 hours after online publication and is updated daily on week days.
Initial download of the metrics may take a while.