Fig. 3.
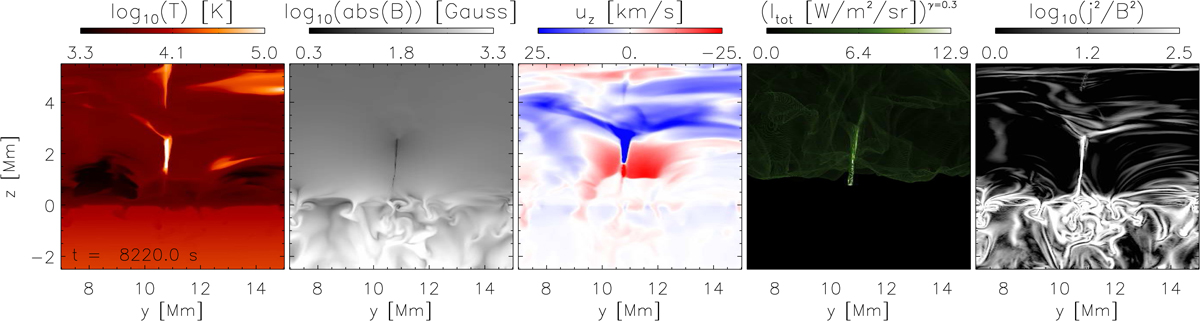
Vertical cuts, at x = 10.78 Mm in the yz plane, of regions in the vicinity of the current sheet of Fig. 1 at t = 8220 s near the time of maximum intensity of the Si IV lines. From left to right: log temperature, log total magnetic field strength, vertical velocity, Si IV 139.376 nm emission, and current density (j2/B2). The temperature is saturated at log(T)=5 and the velocity at uz = [ − 25, 25] km s−1, the maximum values of these quantities are higher than plotted here, as shown in Fig. 8. A movie showing the time evolution of the current sheet is available online.
Current usage metrics show cumulative count of Article Views (full-text article views including HTML views, PDF and ePub downloads, according to the available data) and Abstracts Views on Vision4Press platform.
Data correspond to usage on the plateform after 2015. The current usage metrics is available 48-96 hours after online publication and is updated daily on week days.
Initial download of the metrics may take a while.