Fig. B.1
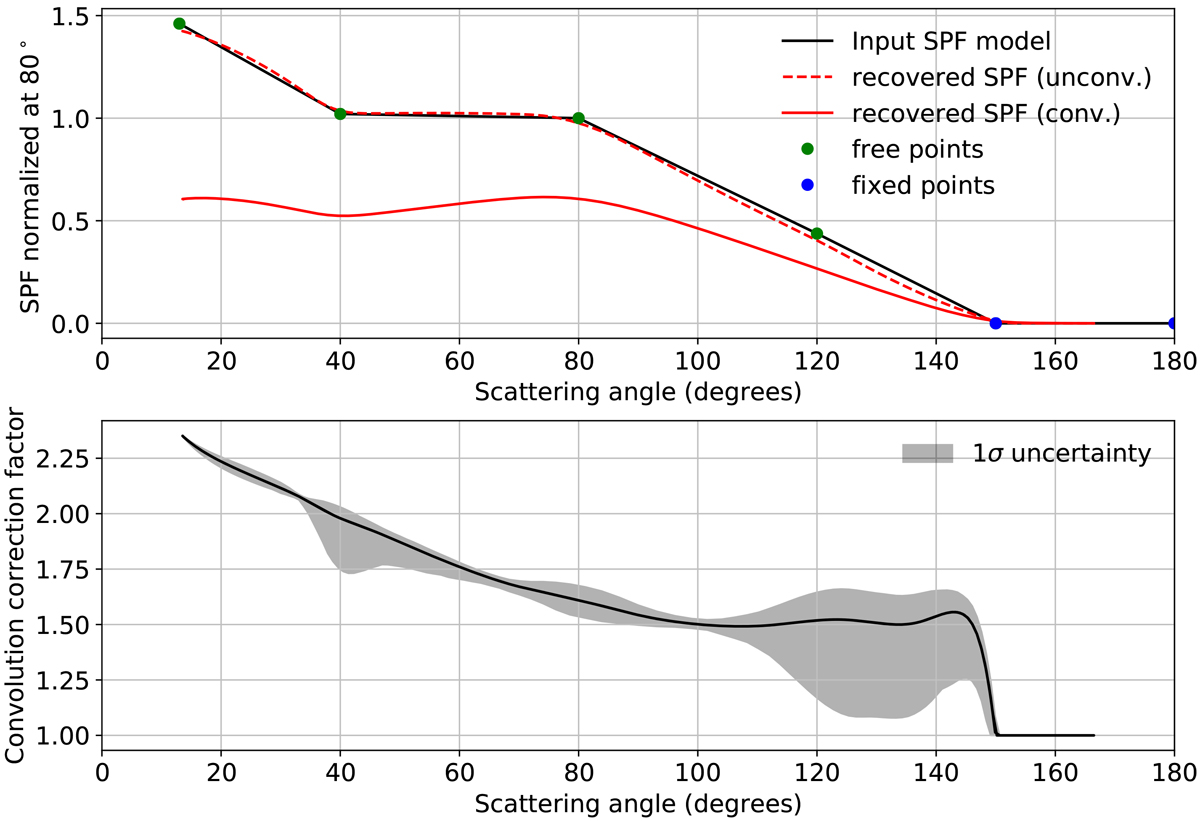
Top: model of the best polarised SPF matching the data (black curve), described as a piecewise linear function with 6 nodes (the 4 green dots are the degrees of freedom for the fit, the 2 blue dots are fixed parameters). This input pSPF is compared to the pSPF as extracted from the synthetic image using the elliptical aperture technique described in Sect. 3.2 before convolution (red dashed line) and after convolution (red plain line). Bottom: correction factor account for the effect of convolution (corresponding to the ratio between the dashed and plain red line). The grey shaded area corresponds to the 1σ uncertainty propagated from the MCMC result.
Current usage metrics show cumulative count of Article Views (full-text article views including HTML views, PDF and ePub downloads, according to the available data) and Abstracts Views on Vision4Press platform.
Data correspond to usage on the plateform after 2015. The current usage metrics is available 48-96 hours after online publication and is updated daily on week days.
Initial download of the metrics may take a while.