Free Access
Fig. B.2
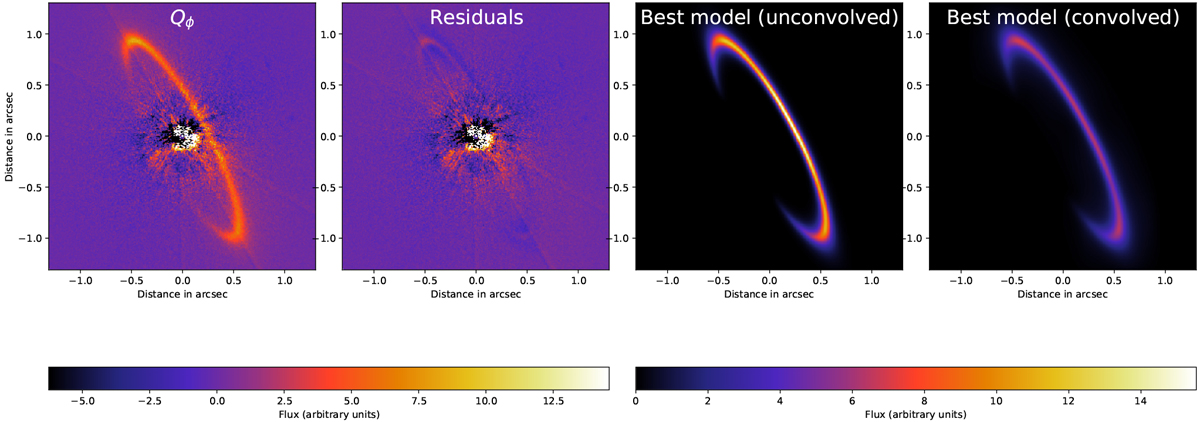
From left to right: original Qϕ image, residuals after subtraction of the best model showing only some residual disc flux in the brighter north ansa, and the unconvolved model and the convolved model. The first two images and last two images have the same linear colour scale.
Current usage metrics show cumulative count of Article Views (full-text article views including HTML views, PDF and ePub downloads, according to the available data) and Abstracts Views on Vision4Press platform.
Data correspond to usage on the plateform after 2015. The current usage metrics is available 48-96 hours after online publication and is updated daily on week days.
Initial download of the metrics may take a while.