Fig. 5
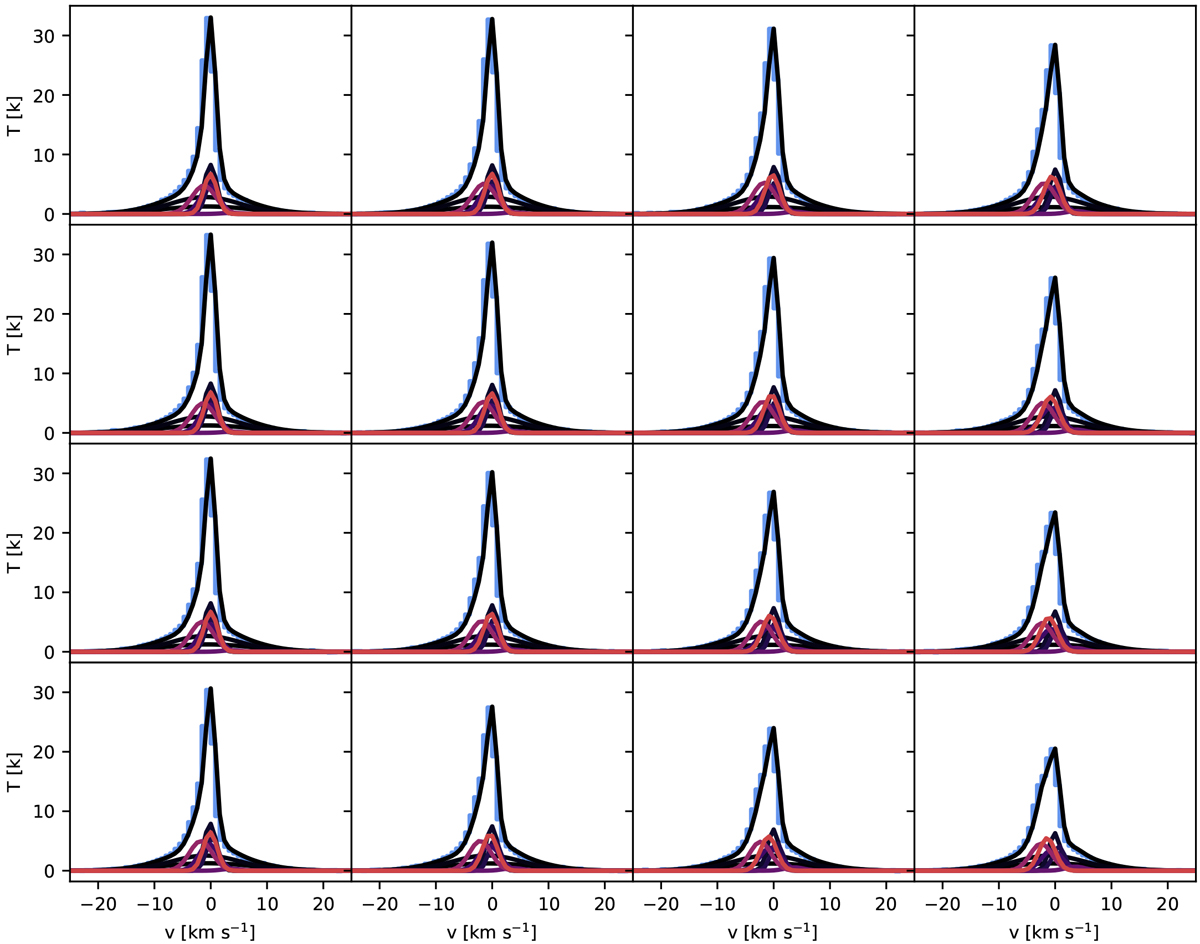
Example of the Gaussian decomposition obtained by ROHSA for a random 4 × 4 mosaic of the synthetic observation. The original signal is shown in blue and the total brightness temperature encoded by ROHSA is shown in black. The other lines show the individual Gaussian components. The spatial coherence of the solution canbe seen over the mosaic with a smooth variation of the amplitude, the central velocity and the dispersion velocity of each component.
Current usage metrics show cumulative count of Article Views (full-text article views including HTML views, PDF and ePub downloads, according to the available data) and Abstracts Views on Vision4Press platform.
Data correspond to usage on the plateform after 2015. The current usage metrics is available 48-96 hours after online publication and is updated daily on week days.
Initial download of the metrics may take a while.