Fig. 13
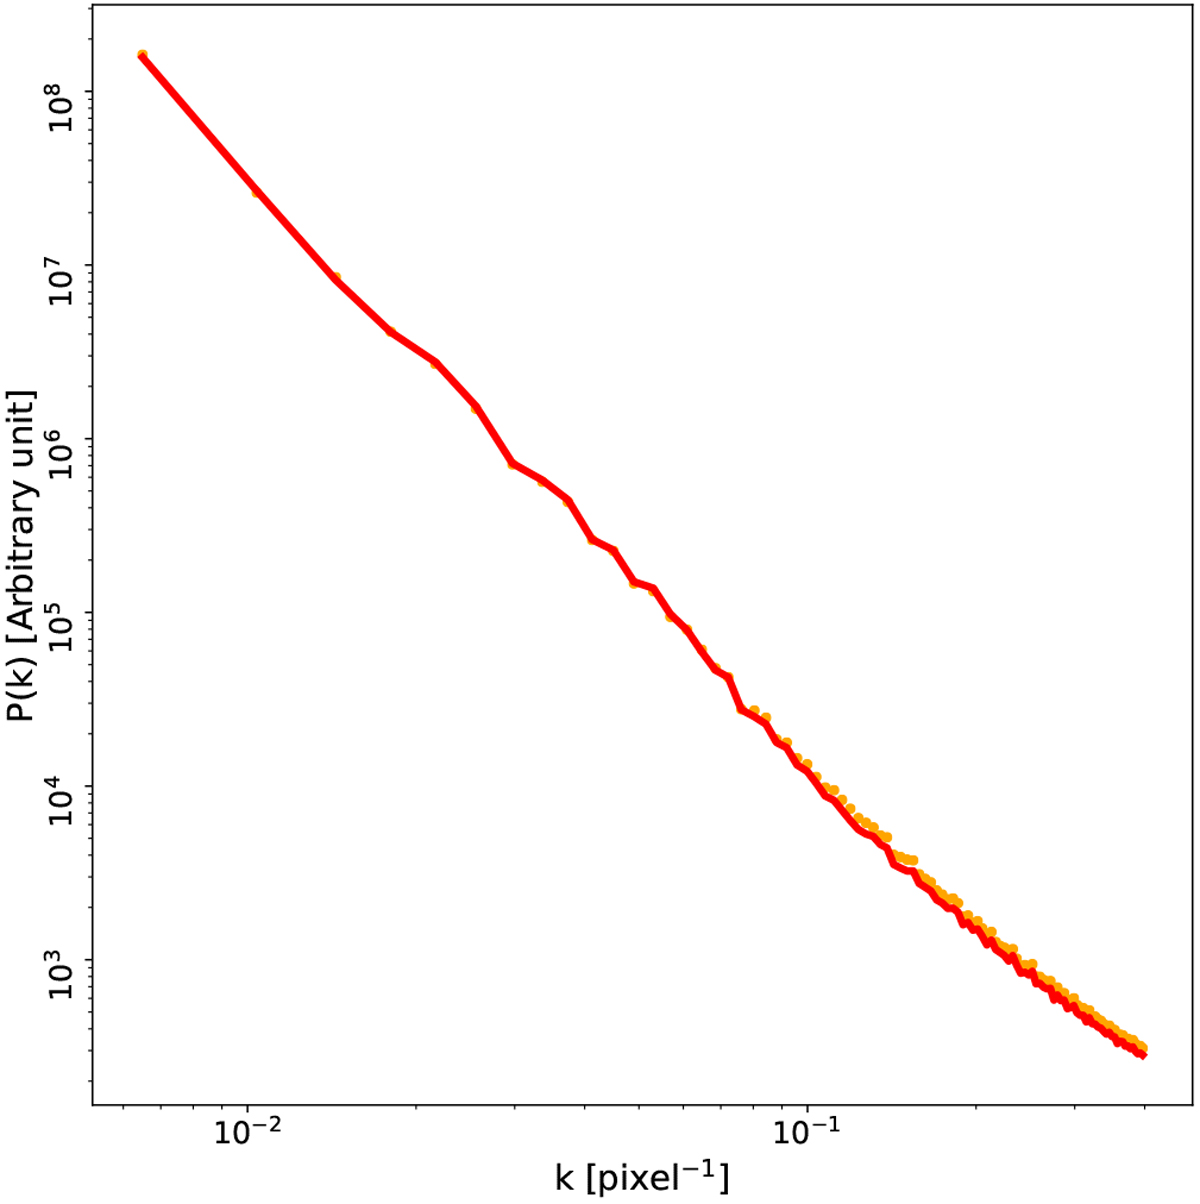
Spatial power spectrum of the centroid velocity field for the inter-cloud medium (WNM + LNM). The orange dotted line indicates the inter-cloud medium inferred directly from the simulation using all cells with Tk lim,LNM/WNM > 500 K (bottom-right panel of Fig. 11). The red line shows the inter-cloud medium inferred with ROHSA (bottom-leftpanel of Fig. 11).
Current usage metrics show cumulative count of Article Views (full-text article views including HTML views, PDF and ePub downloads, according to the available data) and Abstracts Views on Vision4Press platform.
Data correspond to usage on the plateform after 2015. The current usage metrics is available 48-96 hours after online publication and is updated daily on week days.
Initial download of the metrics may take a while.