Open Access
Fig. 10
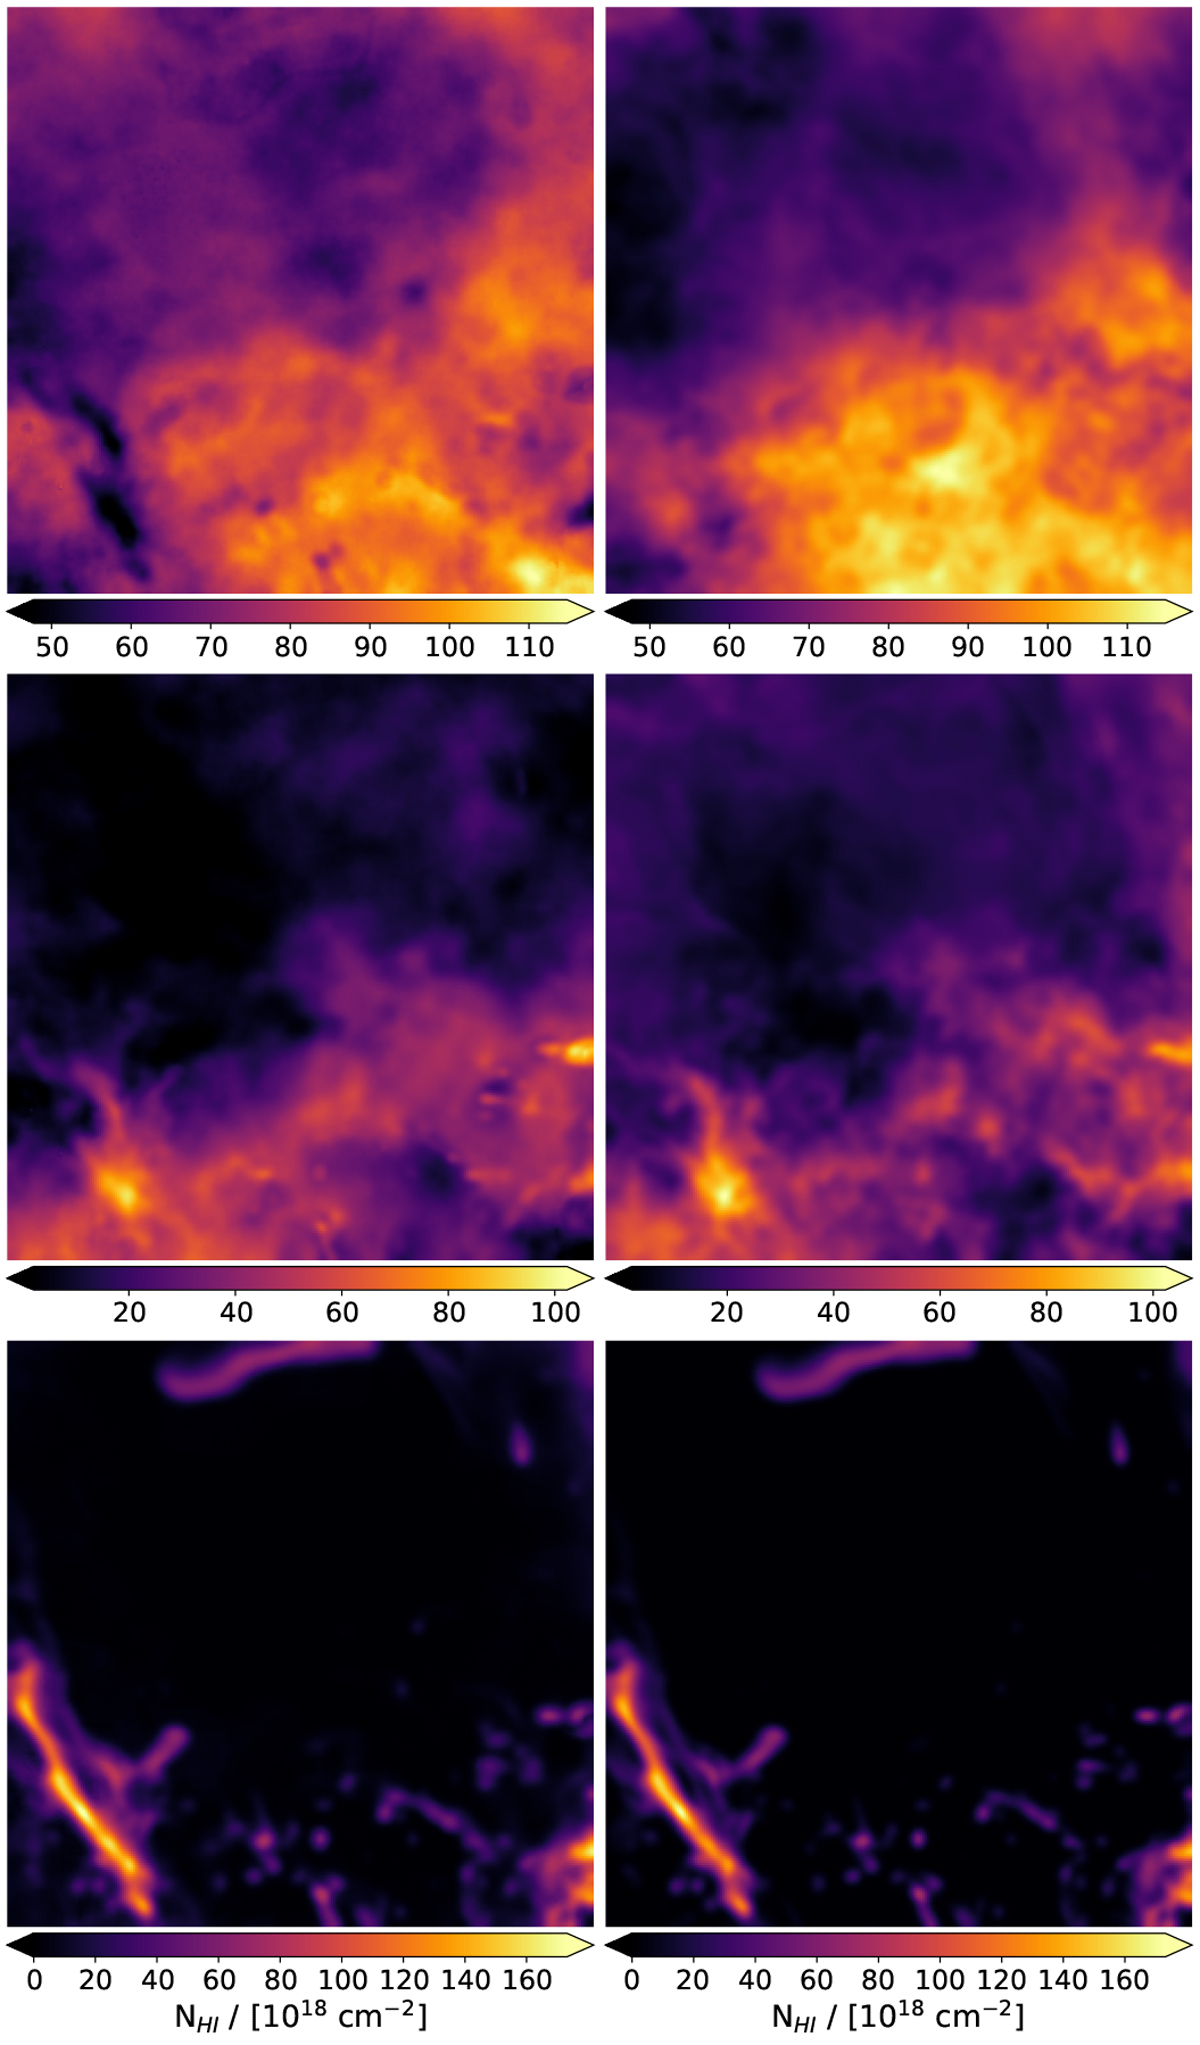
Left: integrated column density maps of the three-phase model extracted by ROHSA. Right: integrated column density maps of the three-phase model inferred directly from the simulation using the canonical values Tk lim,CNM/LNM = 500 and Tk lim,LNM/WNM = 5000 K. The phases WNM, LNM, and CNM are presented from top to bottom.
Current usage metrics show cumulative count of Article Views (full-text article views including HTML views, PDF and ePub downloads, according to the available data) and Abstracts Views on Vision4Press platform.
Data correspond to usage on the plateform after 2015. The current usage metrics is available 48-96 hours after online publication and is updated daily on week days.
Initial download of the metrics may take a while.