Fig. 9.
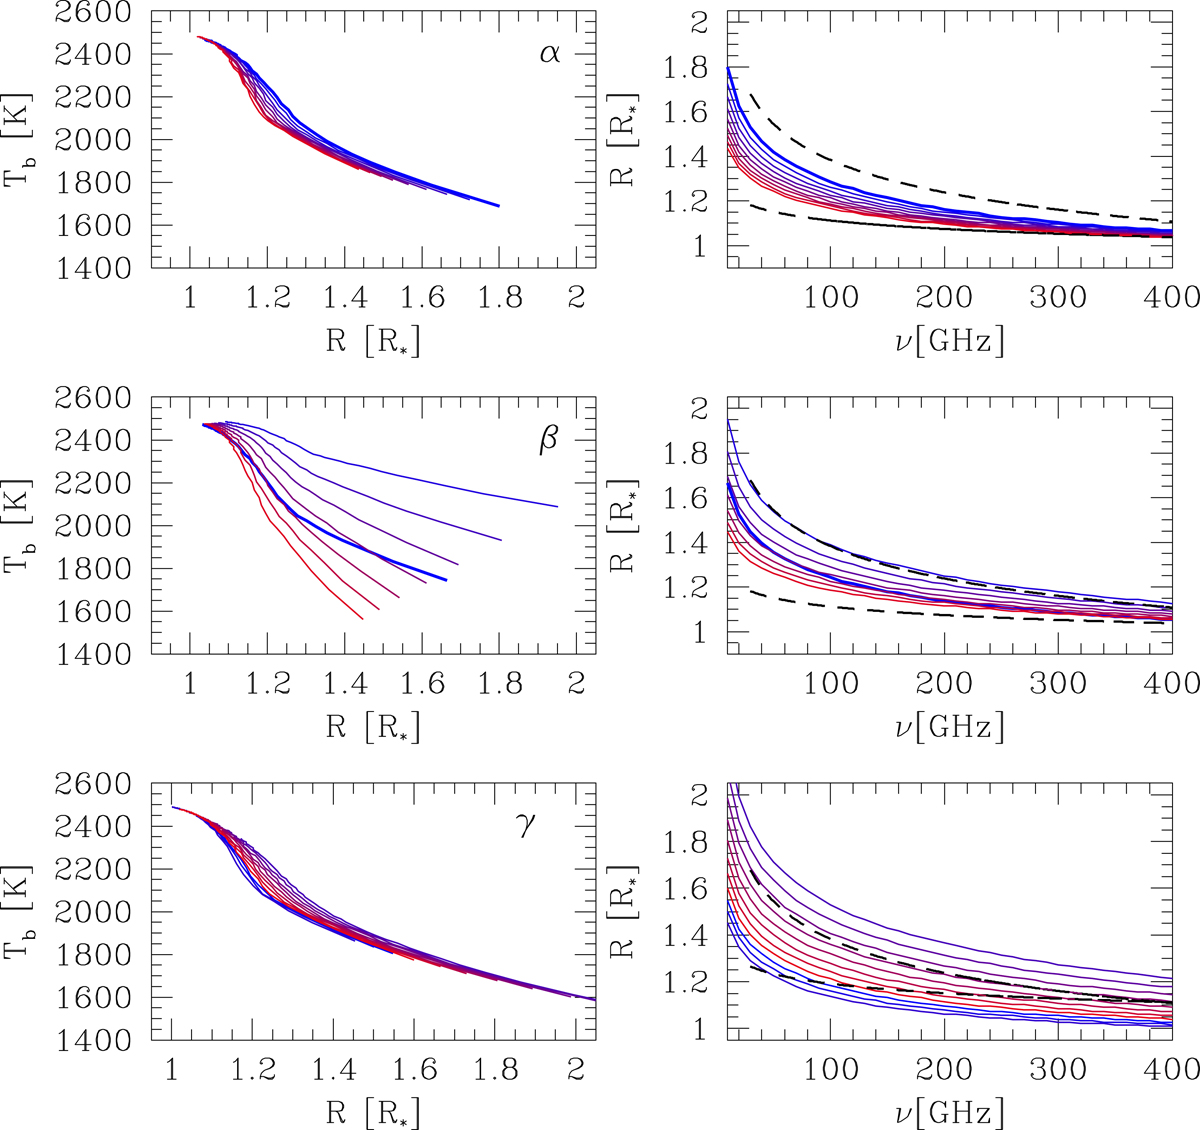
Brightness temperature vs. size (left column) and size vs. frequency (right column) relations for model atmospheres (see text) with different power-law slopes for the density profile (α, top), temperature profile (β, middle), and ionisation (γ, bottom). The two dashed lines indicate the range of the observed slopes of the size vs. frequency relation (η). Standard parameters are given in Table 3. We vary α from 5 (blue) to 9 (red) in steps of 0.5. We vary β from 0.3 (blue) to 1.5 (red) in steps of 0.2 and include the grey atmosphere model (dark blue). We vary γ from 2 (blue) to 12 (red) in steps of 1.
Current usage metrics show cumulative count of Article Views (full-text article views including HTML views, PDF and ePub downloads, according to the available data) and Abstracts Views on Vision4Press platform.
Data correspond to usage on the plateform after 2015. The current usage metrics is available 48-96 hours after online publication and is updated daily on week days.
Initial download of the metrics may take a while.