Fig. 5.
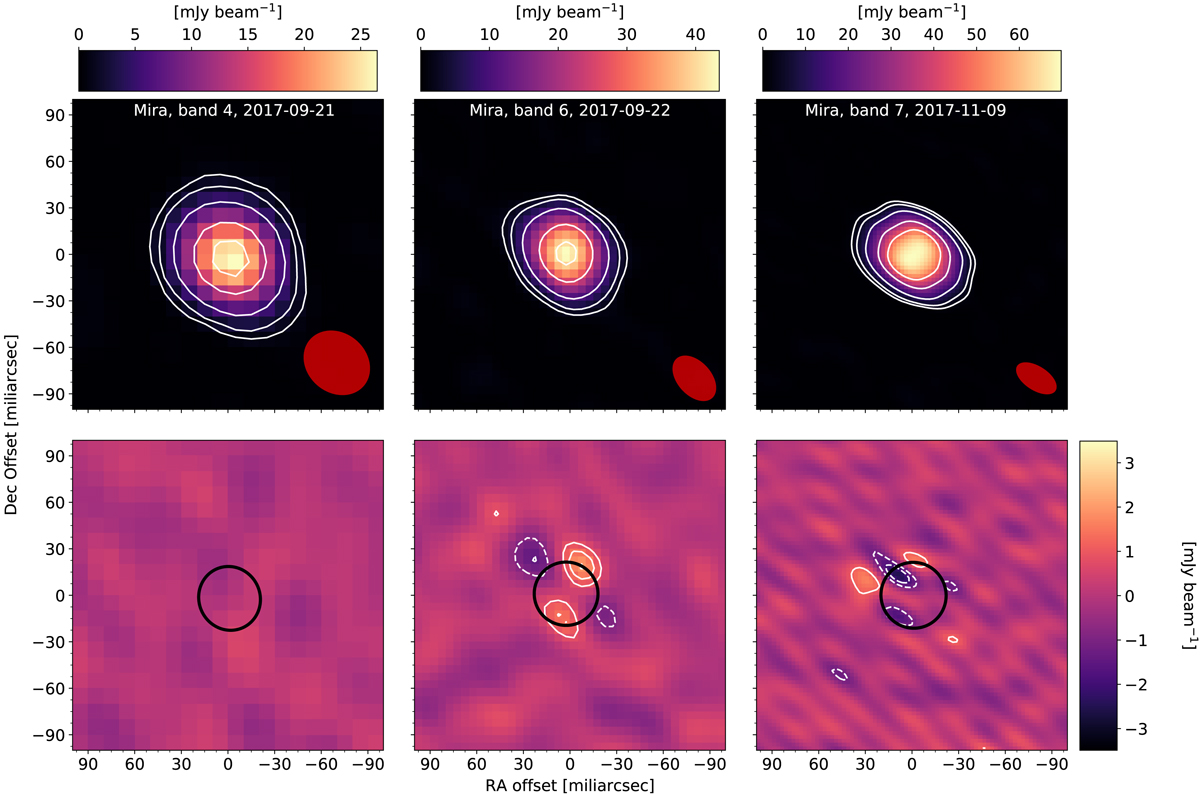
Top row: uniformly weighted continuum maps of Mira A in the three observed bands. The images serve as an illustration since the analysis is performed on the visibilities by uv fitting. The images are produced for a single spw, using the highest frequency spw in each observing band. Contours are drawn at 4, 8, 20, 50, and 80σ, where σ = 0.28, 0.50, and 0.58 mJy beam−1 from left to right. The beam sizes, from left to right, are 45 × 38, 34 × 21, and 29 × 15 mas. Bottom row: residual images after subtracting the best-fit uniform disc model presented in Table A.1. The models are fitted for the spectral windows individually and the subsequent residual image is produced using all spectral windows. The beam sizes, from left to right, are 45 × 37, 33 × 21, and 27 × 13 mas. Contours are drawn at −15, −10, −7, −5, −3, 3, 5, 7, 10, and 15σ, where σ = 0.21, 0.27, and 0.37 mJy beam−1 from left to right. The black ellipse indicates the size of the best-fit uniform stellar disc model for the spw presented in the top panel.
Current usage metrics show cumulative count of Article Views (full-text article views including HTML views, PDF and ePub downloads, according to the available data) and Abstracts Views on Vision4Press platform.
Data correspond to usage on the plateform after 2015. The current usage metrics is available 48-96 hours after online publication and is updated daily on week days.
Initial download of the metrics may take a while.