Fig. 4.
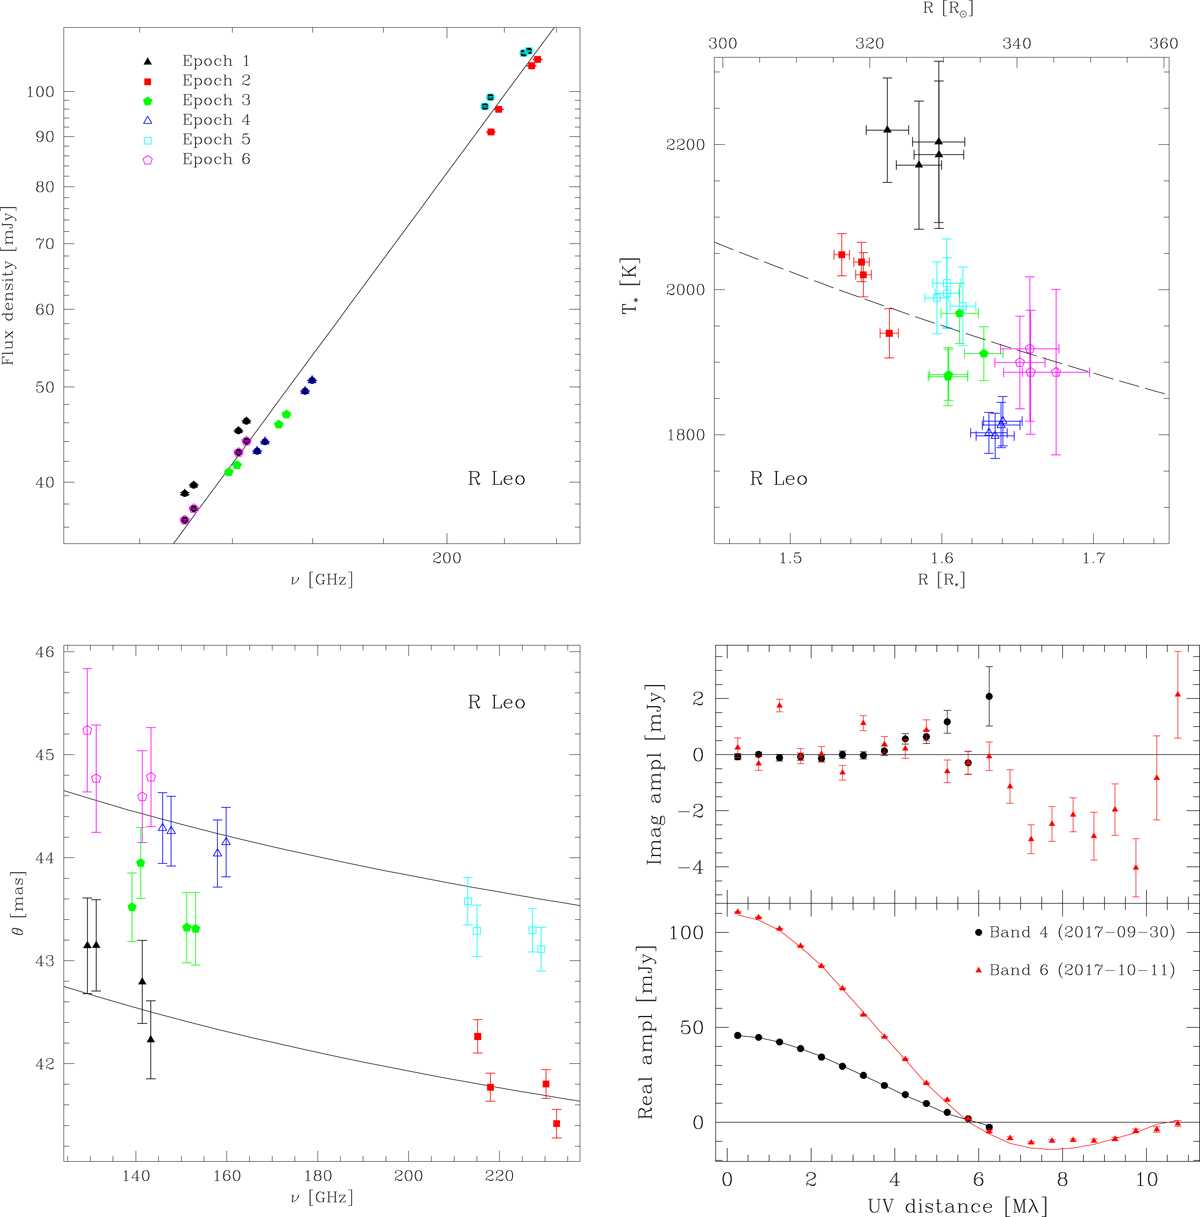
As Fig. 1 for R Leo. The six different epochs are denoted by the symbols and colours as indicated in the top left panel. No fits are indicated for the individual epochs in the temperature vs. radius (top right panel). The long-dashed line indicates the grey atmosphere temperature profile with a temperature at R* of T = 2850 K. In the bottom left, the lines indicate the maximum and minimum power-law fit to the size vs. frequency relation when correcting each epoch for the observed expansion (Sect. 5.2). In the uv plot only two epochs, one for each observing band, are indicated for illustration.
Current usage metrics show cumulative count of Article Views (full-text article views including HTML views, PDF and ePub downloads, according to the available data) and Abstracts Views on Vision4Press platform.
Data correspond to usage on the plateform after 2015. The current usage metrics is available 48-96 hours after online publication and is updated daily on week days.
Initial download of the metrics may take a while.