Fig. 13.
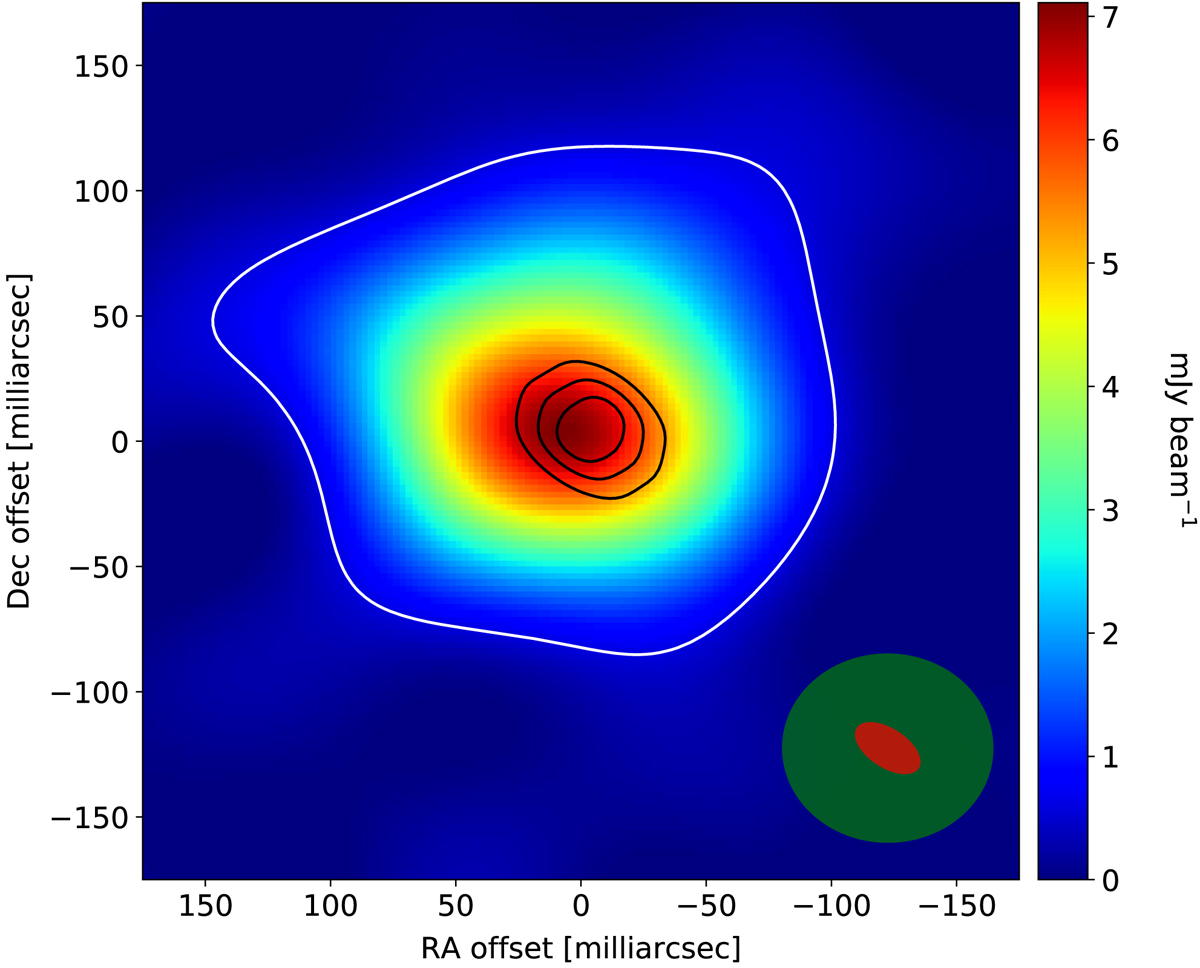
Residual map of the extended emission around Mira A at 332 GHz. We have subtracted the best-fit uniform disc model after fitting to the data with uv distance > 3 Mλ. The residual image is made using Briggs weighting and restricting the baselines to < 2 Mλ, which results in a synthesised beam of 84 × 75 mas at a position angle of 89.6° (indicated in green in the bottom right corner). The black contours are the corresponding map of Mira A using all data drawn at 0.2, 0.5, and 0.8 times the peak intensity. The beam size for all data is shown in red in the bottom right corner. The white contour is drawn at ∼20σ, with σ = 0.13 mJy beam−1. The residual emission has a peak of 7 mJy beam−1, which corresponds to ∼3% of the stellar flux density.
Current usage metrics show cumulative count of Article Views (full-text article views including HTML views, PDF and ePub downloads, according to the available data) and Abstracts Views on Vision4Press platform.
Data correspond to usage on the plateform after 2015. The current usage metrics is available 48-96 hours after online publication and is updated daily on week days.
Initial download of the metrics may take a while.