Fig. 11.
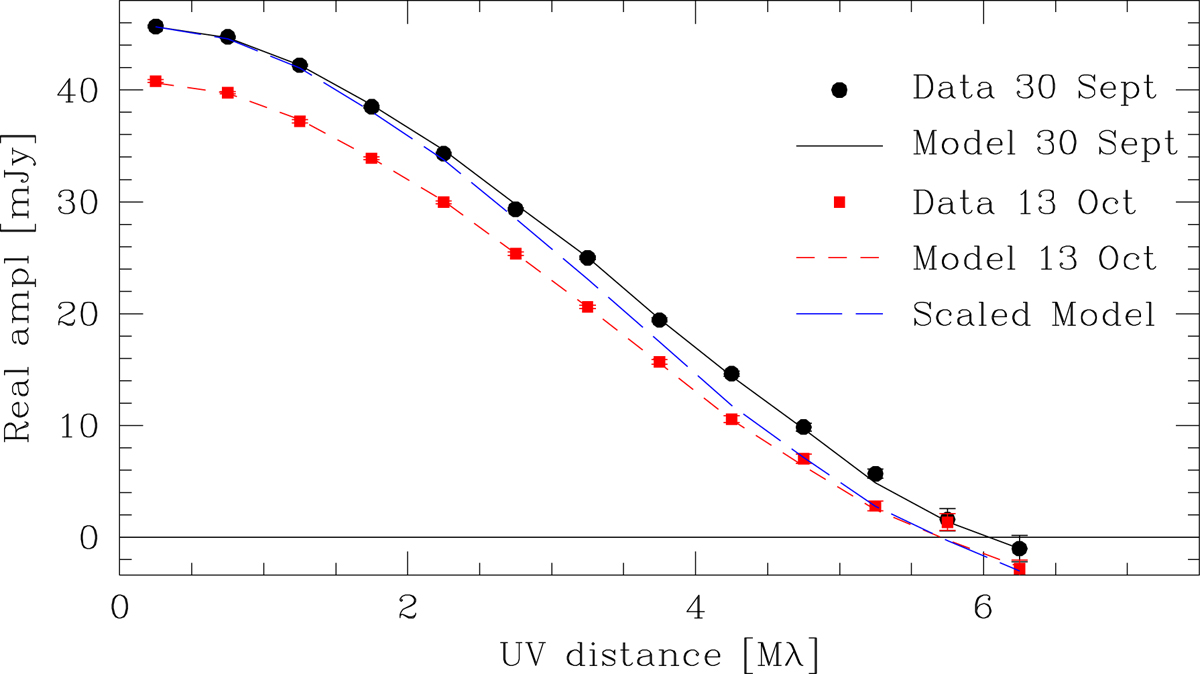
Comparison of the real part of the uv visibilities between R Leo Band 4 observations taken on 2017-09-30 (black solid line and circles) and 2017-10-13 (red dashed line and squares). In most cases the error bars are less than the symbol size. The lines represent the uniform disc model, where the long-dashed blue line corresponds to the best-fit model of the 2017-10-13 observations scaled to the flux density of the 2017-09-30 observations. Although the difference in flux density is most likely predominantly caused by the uncertainty in absolute flux calibration, the long-dashed blue line shows that the change in radius of the model is robustly determined.
Current usage metrics show cumulative count of Article Views (full-text article views including HTML views, PDF and ePub downloads, according to the available data) and Abstracts Views on Vision4Press platform.
Data correspond to usage on the plateform after 2015. The current usage metrics is available 48-96 hours after online publication and is updated daily on week days.
Initial download of the metrics may take a while.