Fig. 10.
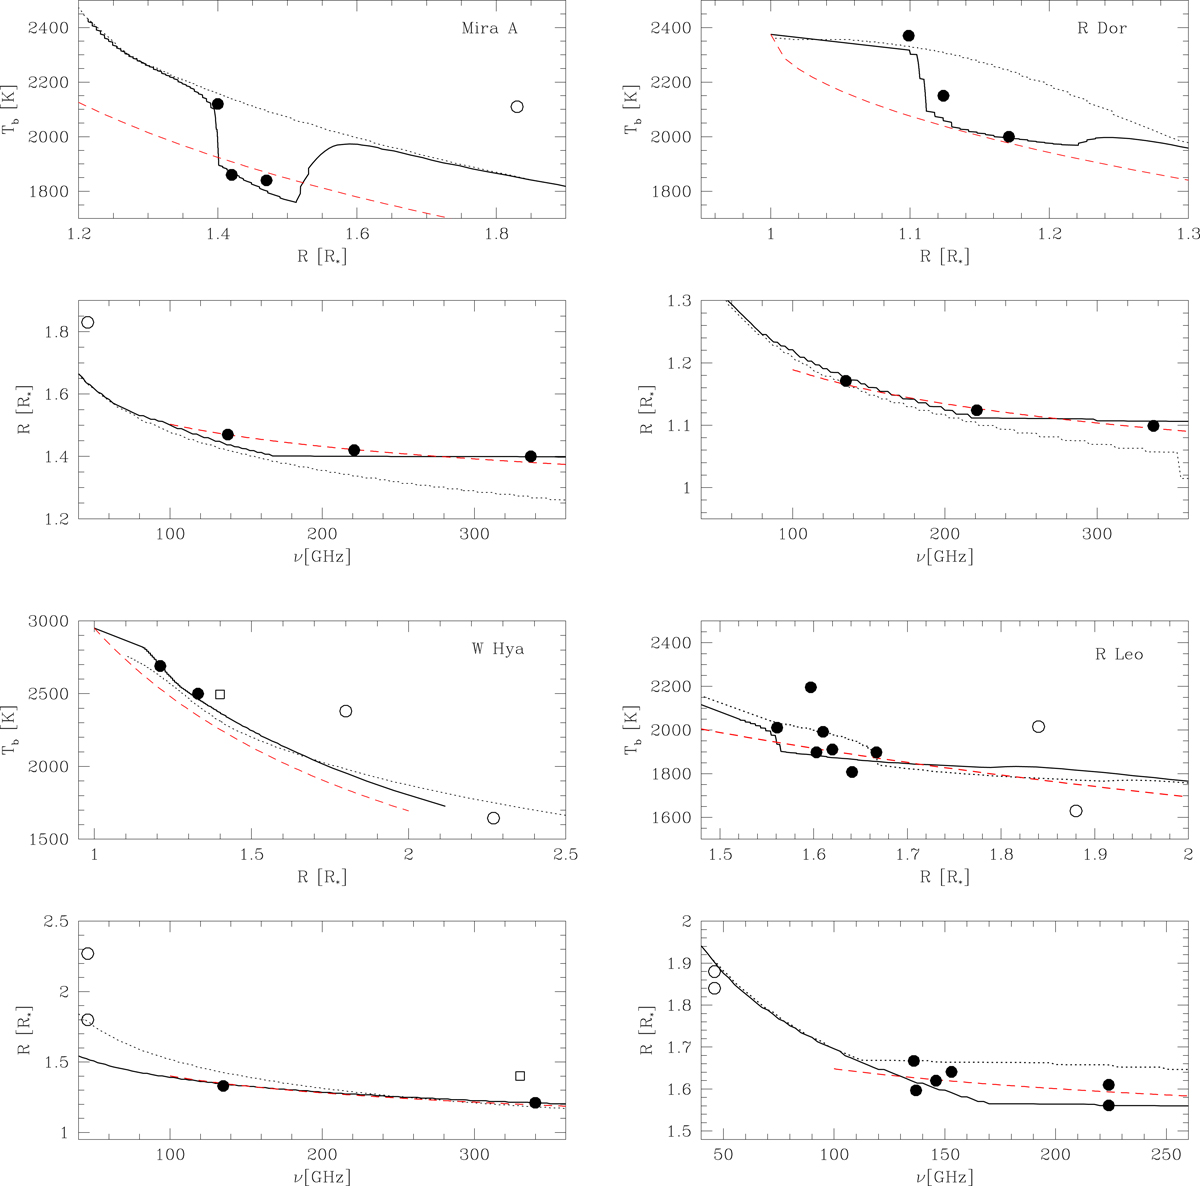
Extended atmosphere models for Mira A (top left), R Dor (top right), W Hya (bottom left), and R Leo (bottom right) that can reproduce our observations. For each star the top panel shows the temperature vs. radius relation and the bottom panel shows the size vs. frequency relation. The solid circles are the measurements presented in this paper, and are taken as an average of all spws per observations. The open circles are 46 GHz radio observations (Matthews et al. 2015, 2018) shown for comparison. The radio observations were taken several years before the ALMA observations. In the panels for W Hya, the open square indicates the ALMA observations taken approximately 2 years earlier (Vlemmings et al. 2017). The thick solid lines are the models described in the text. In the top panels for each star, the red dashed line represents the assumed temperature profile. In the bottom panels for each star, the red dashed lines represent the size vs. frequency power-law relation fitted to the observations. For Mira A and R Dor, the dotted line represents a model without a high-opacity layer. For W Hya the dotted line represents the grey atmosphere model with nH2 ∝ r−3 that comes closest to describing the radio observations. For R Leo the dotted line represents the model for which the layer location has shifted (see text).
Current usage metrics show cumulative count of Article Views (full-text article views including HTML views, PDF and ePub downloads, according to the available data) and Abstracts Views on Vision4Press platform.
Data correspond to usage on the plateform after 2015. The current usage metrics is available 48-96 hours after online publication and is updated daily on week days.
Initial download of the metrics may take a while.