Fig. 1.
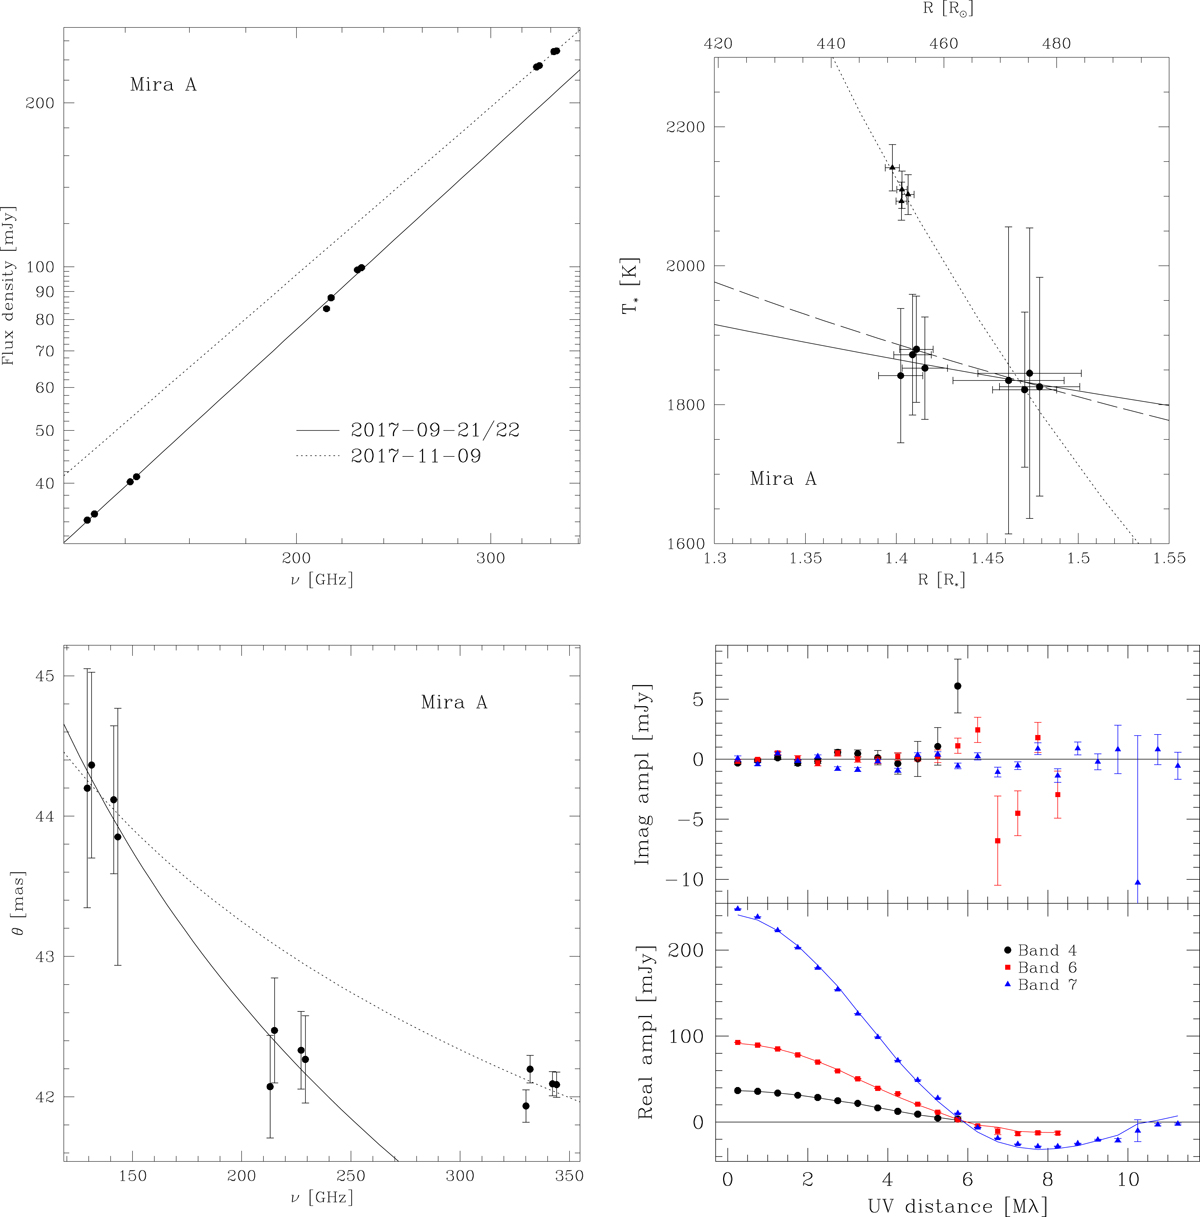
Top left: flux density measurements determined by uv fitting a uniform elliptical stellar disc to Mira A. Only the fitted flux density uncertainties are included. The absolute flux density uncertainty between the different observing bands are discussed in the text. The symbol size is generally larger than the fitted flux density uncertainties. The solid and dotted lines represent a spectral index fit for two observing epochs. Top right: derived temperature vs. radius profiles for Mira A. The solid and dotted lines correspond to the epochs in the top left figure. For illustration, the long-dashed line corresponds to a grey atmosphere temperature profile (RM97) with a temperature at R* of T = 2550 K. Bottom left: size vs. frequency relation at both observing epochs. The size θ denotes the average of the major and minor axis. Bottom right: radially averaged real and imaginary visibilities and the best-fit elliptical stellar disc model of Mira A for the three observed bands.
Current usage metrics show cumulative count of Article Views (full-text article views including HTML views, PDF and ePub downloads, according to the available data) and Abstracts Views on Vision4Press platform.
Data correspond to usage on the plateform after 2015. The current usage metrics is available 48-96 hours after online publication and is updated daily on week days.
Initial download of the metrics may take a while.