Fig. 7
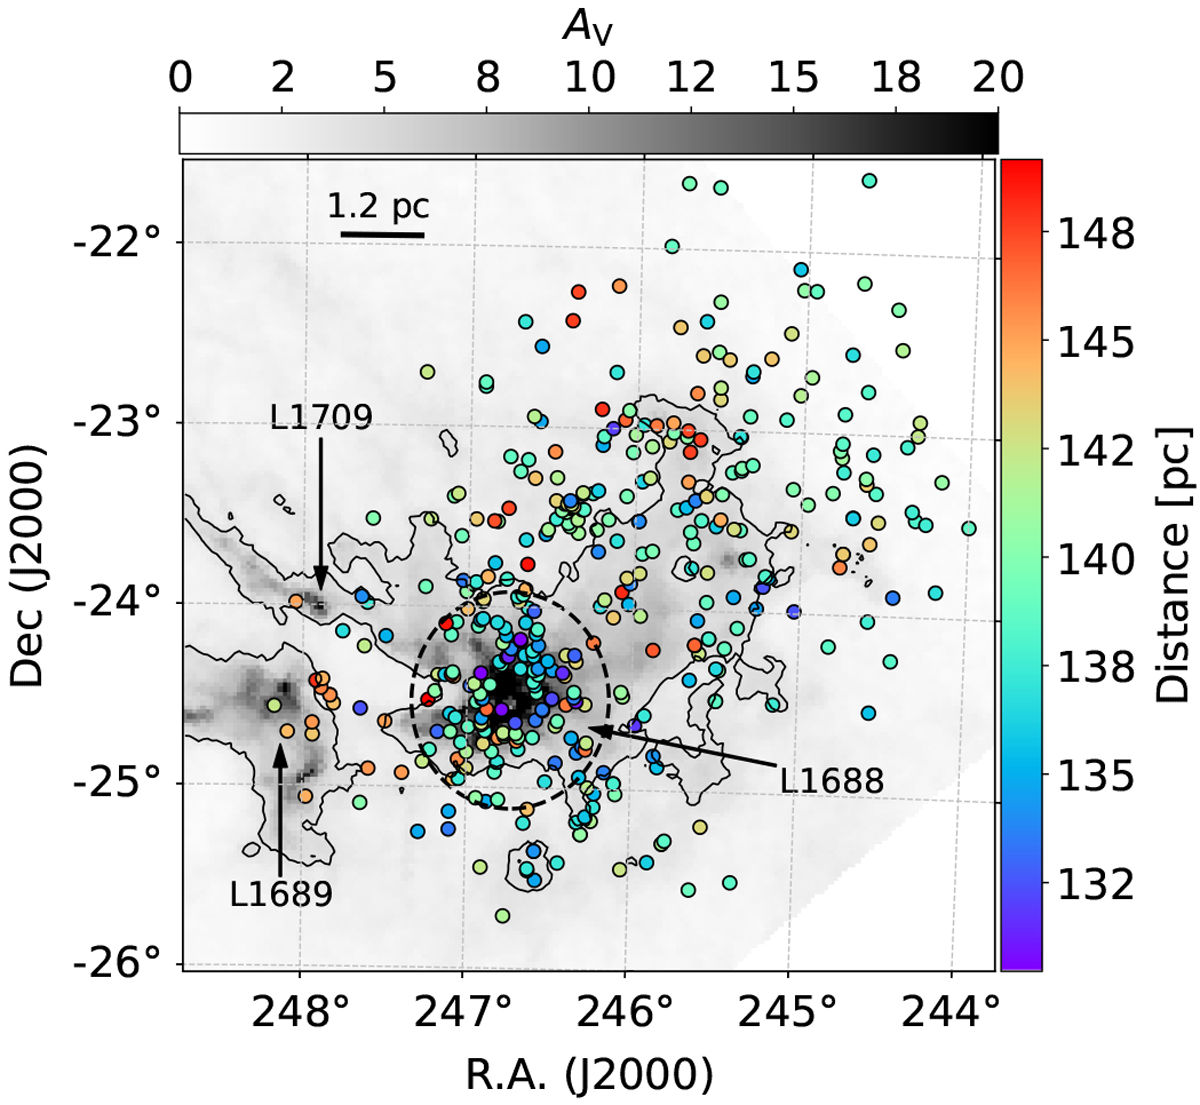
Common sample overlaid on top of an extinction map. The contour delimits the Av = 4 regions. The arrows indicate the location of the main Lynds dark clouds in this area, while the black dashed line encompassesthe r ≤ 0.6° region centred on the extinction peak. The size scale is calibrated for the average distance to the common sample.
Current usage metrics show cumulative count of Article Views (full-text article views including HTML views, PDF and ePub downloads, according to the available data) and Abstracts Views on Vision4Press platform.
Data correspond to usage on the plateform after 2015. The current usage metrics is available 48-96 hours after online publication and is updated daily on week days.
Initial download of the metrics may take a while.