Free Access
Fig. 11
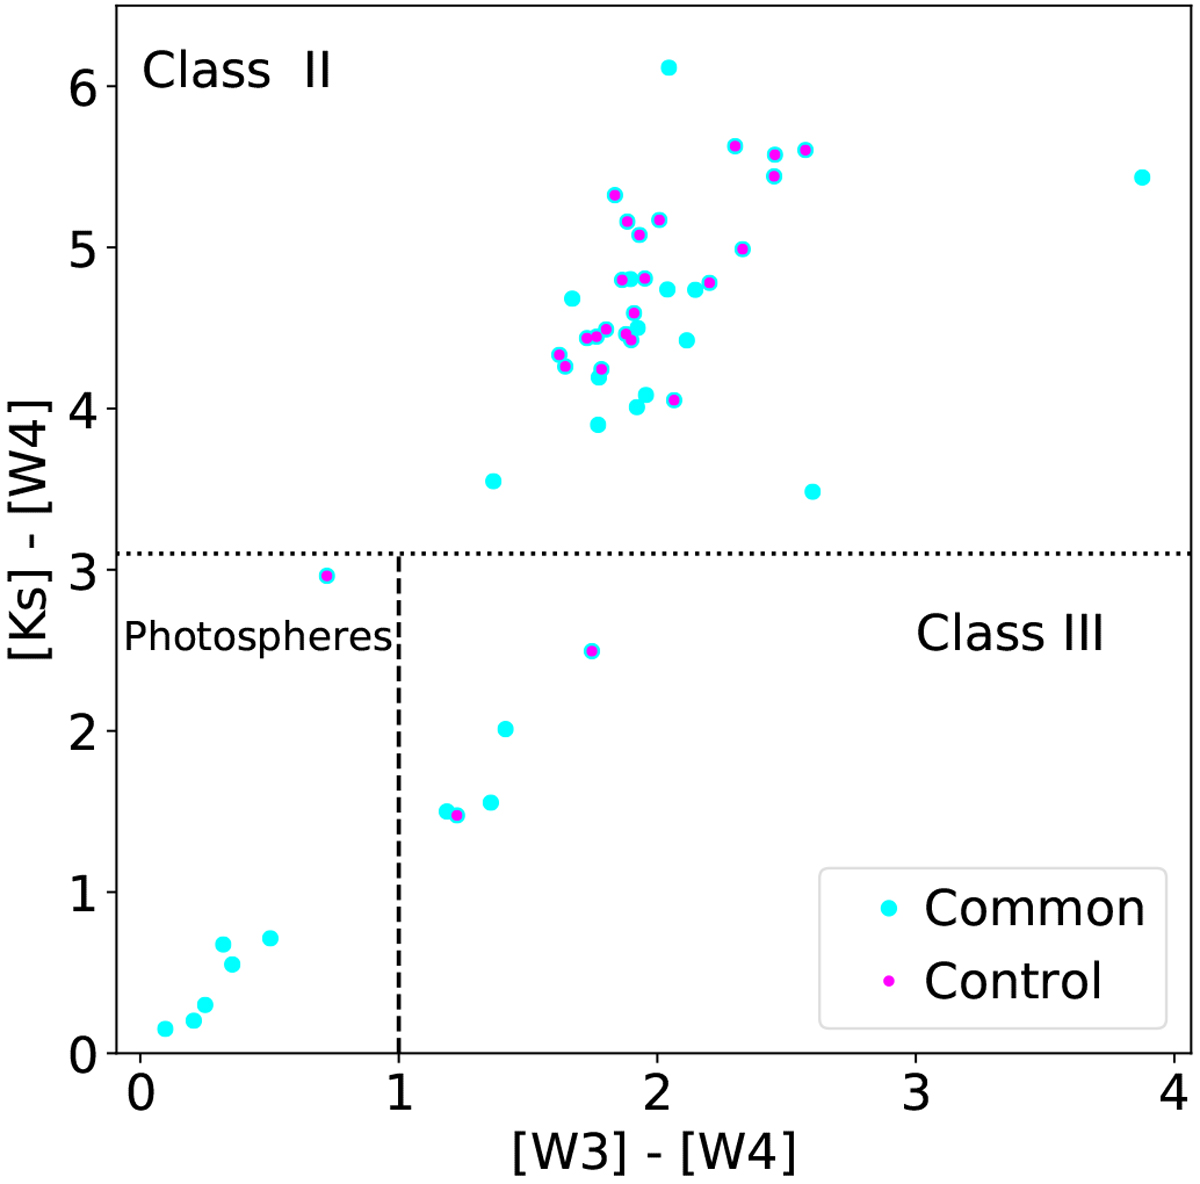
Colour–colour plot of the common sample with high quality infrared photometry. The dotted line indicates the traditional boundary between the Class II and III stages. The vertical dashed line separates bare photospheres from Class III discs.
Current usage metrics show cumulative count of Article Views (full-text article views including HTML views, PDF and ePub downloads, according to the available data) and Abstracts Views on Vision4Press platform.
Data correspond to usage on the plateform after 2015. The current usage metrics is available 48-96 hours after online publication and is updated daily on week days.
Initial download of the metrics may take a while.