Free Access
Fig. 10
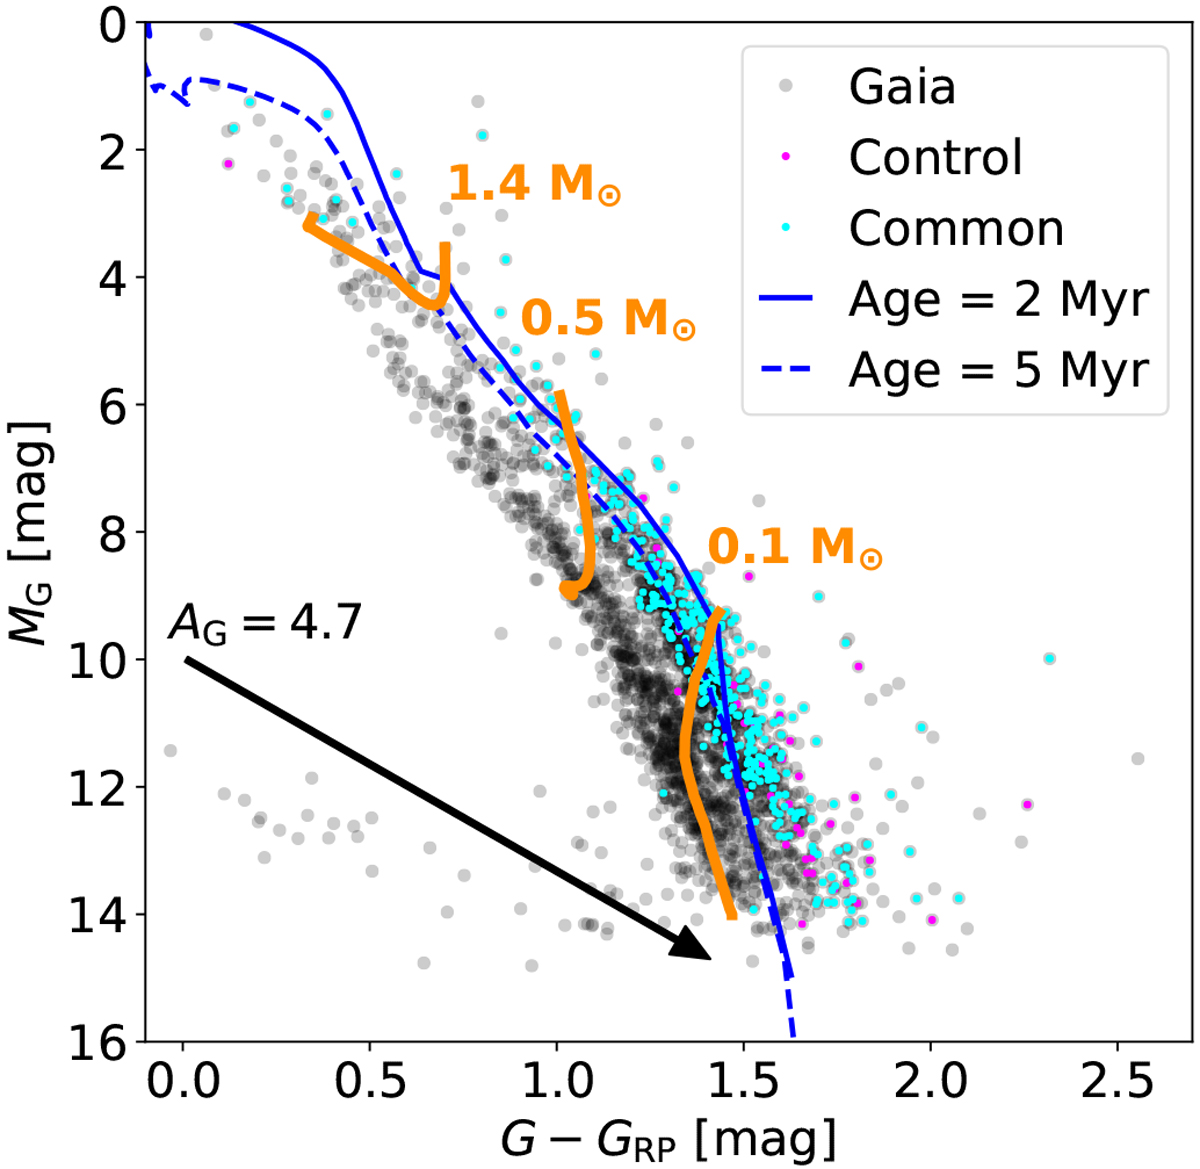
Colour magnitude diagram. The control sample sources not included in the common sample are shown as small magenta circles. The diameter of the black circles is larger than the average photometric error. The extinction vector is computed for the average AG derived from a subset of sources (see Sect. 4.2).
Current usage metrics show cumulative count of Article Views (full-text article views including HTML views, PDF and ePub downloads, according to the available data) and Abstracts Views on Vision4Press platform.
Data correspond to usage on the plateform after 2015. The current usage metrics is available 48-96 hours after online publication and is updated daily on week days.
Initial download of the metrics may take a while.