Free Access
Fig. 14.
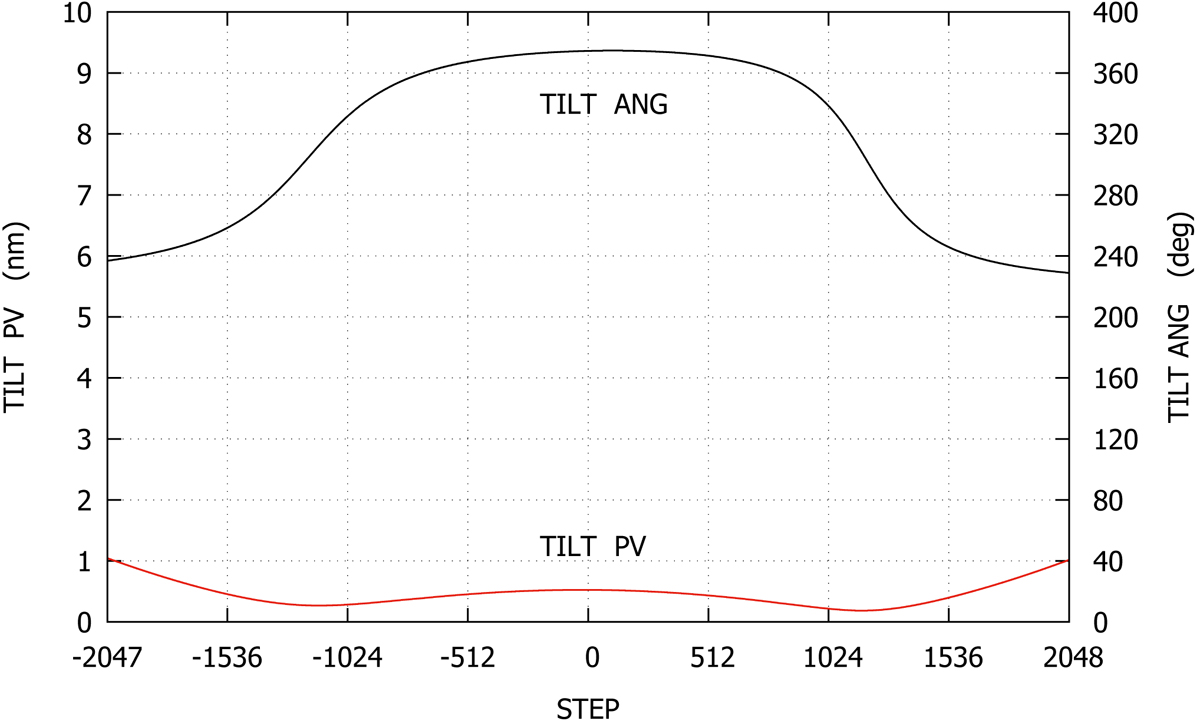
PV and angle of the tilt component of the cavities of Fig. 13 (TILT PV and TILT ANG, respectively), along the full spectral scan. The curves represent the actual values of the parameters derived from the planar fit; both vary very smoothly with n. The tilt PV remains within the 1 nm value.
Current usage metrics show cumulative count of Article Views (full-text article views including HTML views, PDF and ePub downloads, according to the available data) and Abstracts Views on Vision4Press platform.
Data correspond to usage on the plateform after 2015. The current usage metrics is available 48-96 hours after online publication and is updated daily on week days.
Initial download of the metrics may take a while.