Fig. 3.
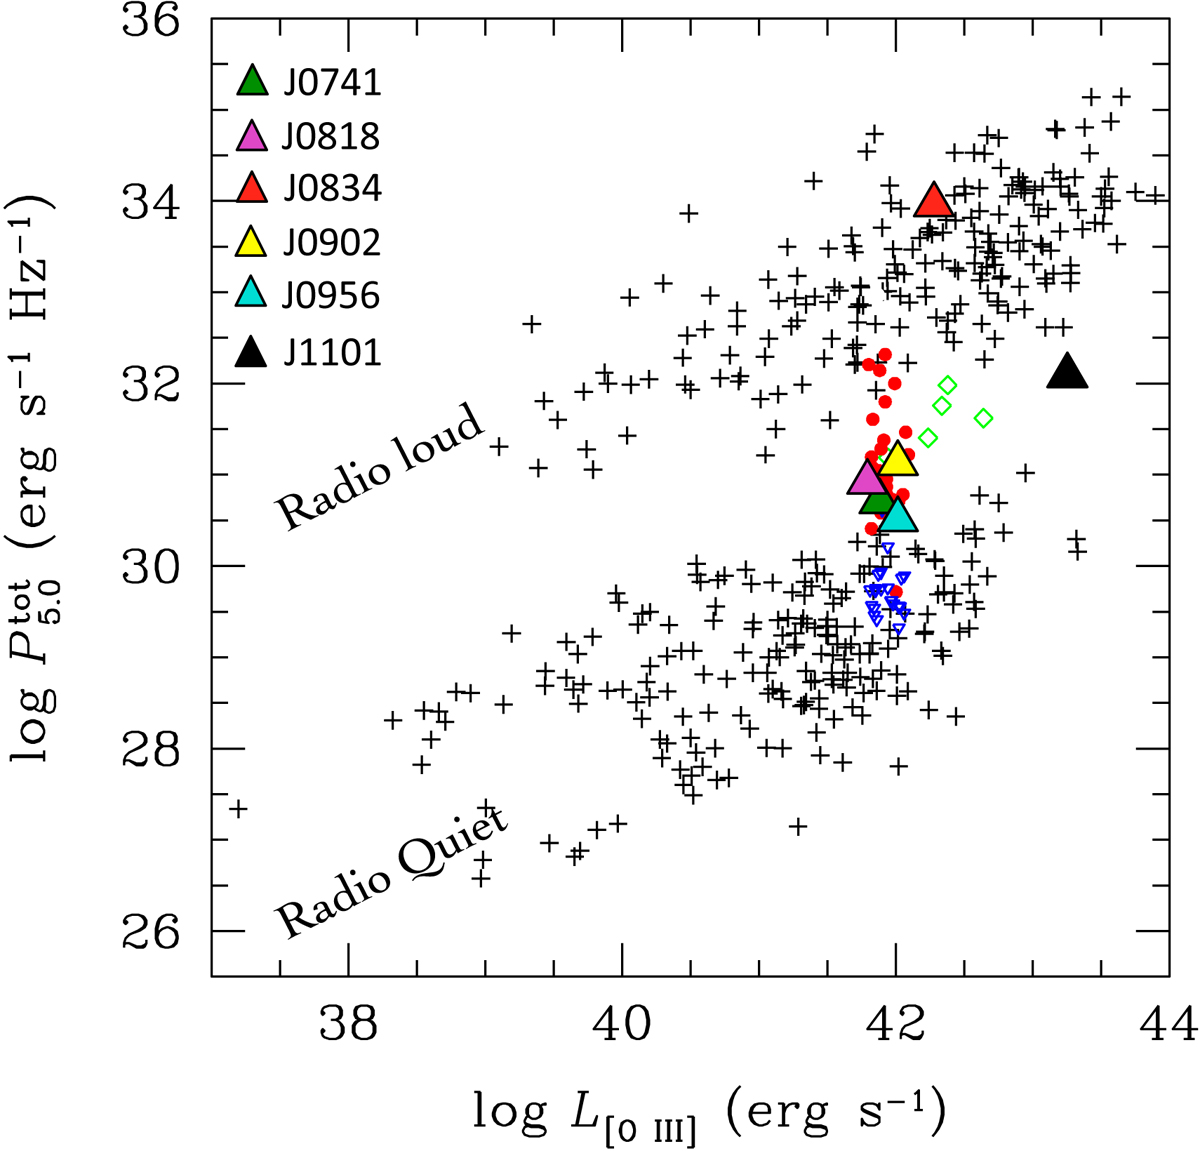
Classification of the sample according to radio loudness. The figure is the same as Fig. 7 in Lal & Ho (2010). The locations of our objects are shown with colored triangles. The cross symbols come from the AGN sample of Xu et al. (1999); the open green diamonds represent their radio-intermediate sources. The Lal & Ho (2010) sample of QSO2 at 0.3 ≤ z ≤ 0.7 is represented with filled red circles. Open blue triangles are upper limits.
Current usage metrics show cumulative count of Article Views (full-text article views including HTML views, PDF and ePub downloads, according to the available data) and Abstracts Views on Vision4Press platform.
Data correspond to usage on the plateform after 2015. The current usage metrics is available 48-96 hours after online publication and is updated daily on week days.
Initial download of the metrics may take a while.