Free Access
Fig. A.5.
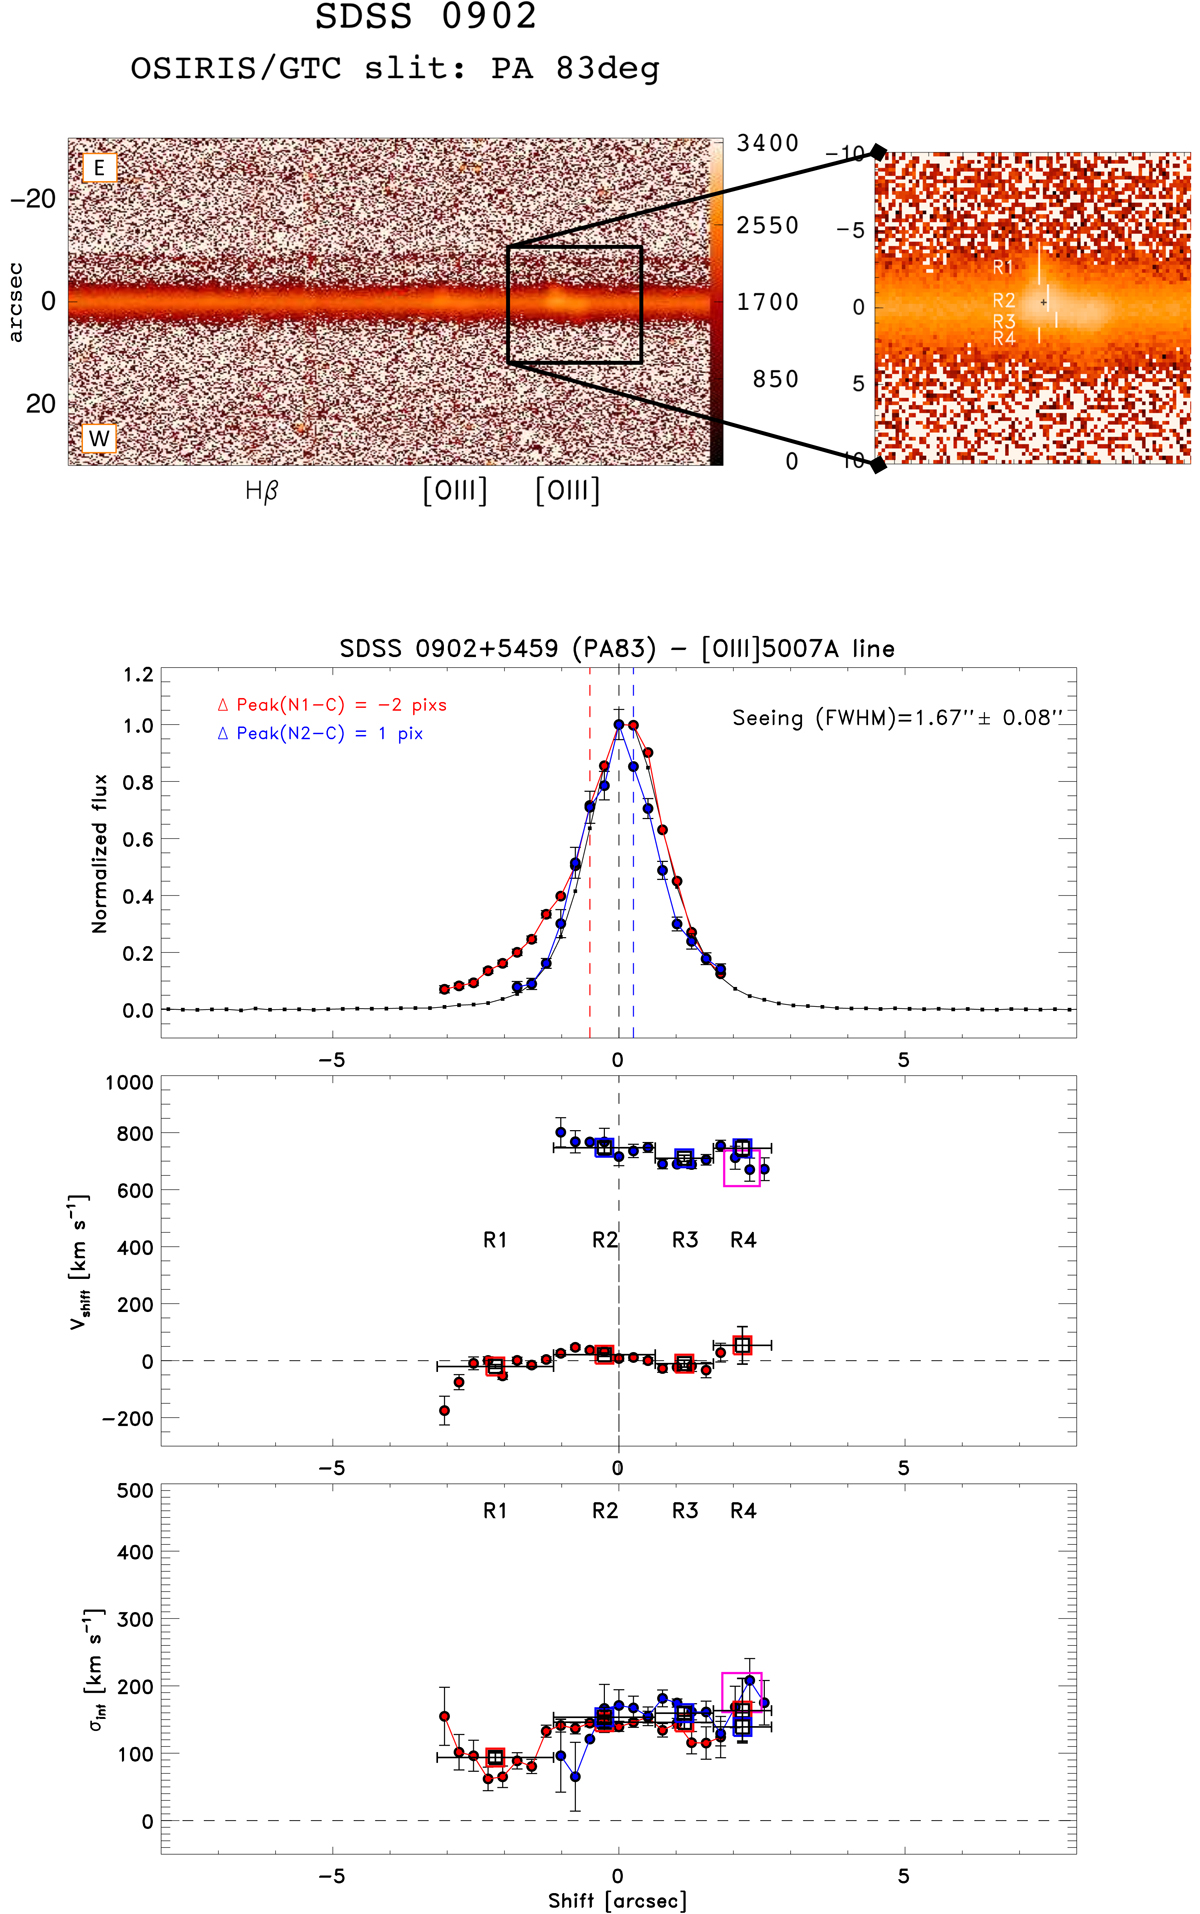
SDSS 0902+5459 (PA 83). Same figure caption as in Fig. A.1. The magenta squares in the velocity field and velocity dispersion plots are used to highlight the pixels that are characterized by low S/N, which are well fit by using only one component instead of two.
Current usage metrics show cumulative count of Article Views (full-text article views including HTML views, PDF and ePub downloads, according to the available data) and Abstracts Views on Vision4Press platform.
Data correspond to usage on the plateform after 2015. The current usage metrics is available 48-96 hours after online publication and is updated daily on week days.
Initial download of the metrics may take a while.